Announcements
GRACES performs high-resolution echelle spectroscopy between 400 and 1,000nm. It is offered in two spectroscopic modes.
- 1-fiber (object-only) mode, in which we only collect the spectrum of the star and neglect that from the background sky. The image of the single fiber is sliced in 4 at the spectrograph entrance, which provides a maximum spectral resolution of R~67,500 (as measured during phase I commissioning). It is the recommended mode for brightest targets (V<19 mag) that outshine the sky background. Note that for data reduced with Opera, the resolution attained for 1-f mode is 61-65k, highest in the range 600-850nm, while data reduced with DRAGRACES have an average resolution of 55k.
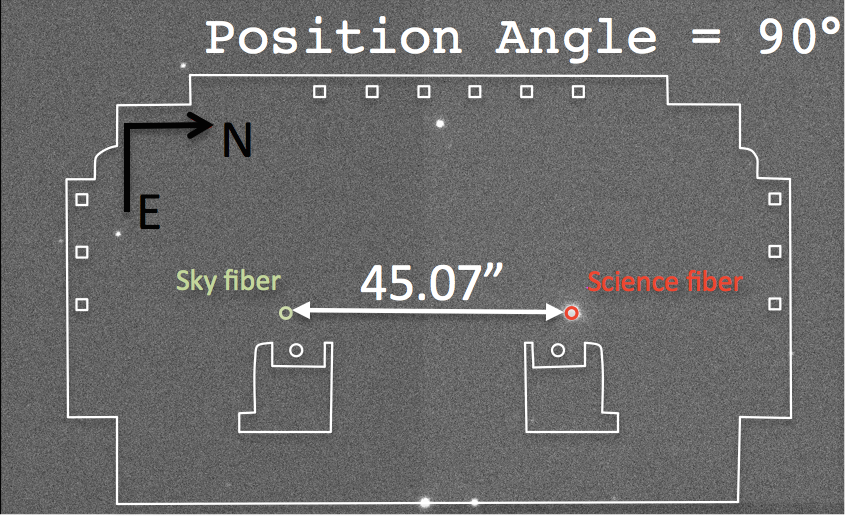
- 2-fiber (object+sky) mode, in which the spectrum of the star and of the background sky are recorded simultaneously on the CCD (with orders interleaved). The image of the two fibers are sliced in 2 each at the spectrograph entrance, which provides an average spectral resolution of R~40,000 (as measured during phase I commissioning). Note that you may want to orient the "Sky fiber", using the instrument Position Angle, so it does not fall on another source. The image below shows how the "Science" and the "Sky" fibers are oriented. Also note that the resolution for Opera reduced spectra is ~36-40k with the highest resolution between 650-900nm, while data processed with DRAGRACES have a resolution ~37k.
|
|
|
Orientation of the fibers, when the instrument Position Angle (PA) is 90°. In this case, the "Sky" fiber is 45.07 arcsec South of the "Science target. If PA=0°, then the "Sky" fiber is towards the East. |
Most of the "work" is done by the ESPaDOnS spectrograph. The Gemini user has to choose a spectroscopic mode, and to prepare the acquisition. The acquisition is done using GMOS imaging mode. See the following pages for more details.
Spectral Range and Resolution
The full GRACES spectral is 400-1,050nm. The useful range is 420-1,010nm, and the GRACES sensitivity is at its best between 490 and 950nm (see the Sensitivity page for more details)
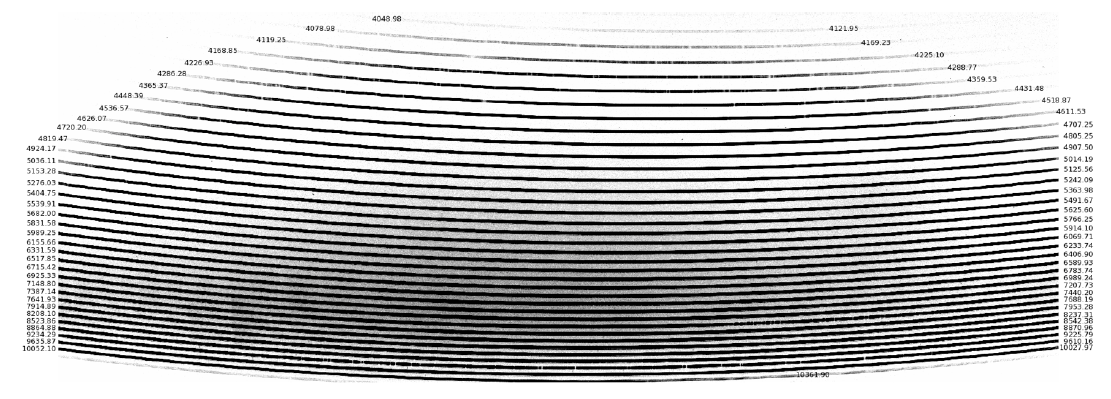
This figure shows the raw 2D spectrum of the A3 star HIP 57258. It also is the GRACES phase I first light!
The spectral resolution was originally calculated based on ~100 lines of an observed ThAr lamp spectrum. The average resolution element for the one-fiber mode was determined to be 1.74 pixels, giving an average resolving power of R~67,500 (However, see below). For the two-fiber mode, we got 2.88 pixels per resolution element, giving a resolving power of ~40,000. The figure below shows the resolution as a function of the wavelength, from 4500 to 8500 angstroms. The solid lines are the averages for each mode, and the shaded areas represent ±1 sigma from the mean values.
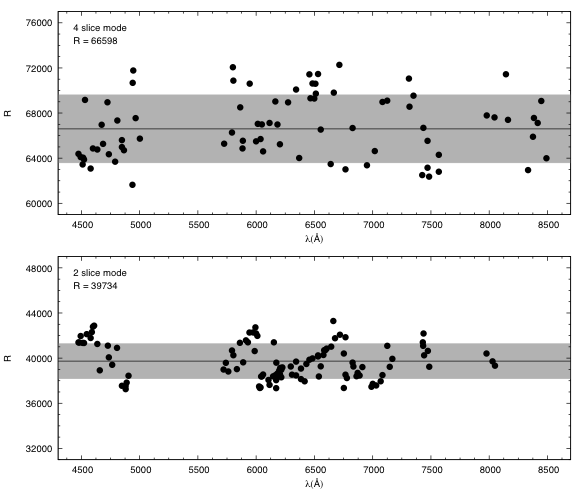
The resolution was later measured from data processed with Opera and with DRAGRACES. We found that for 2-fiber mode, Opera reduced spectra have a resolution of 36-40k with the highest resolution between 650-900nm. For 1-fiber mode, Opera reduced spectra have a resolution of 61-65k. It is highest in the range 600-850nm, but never quite reaches 66k. With DRAGRACES, the resolution of the processed data is a bit lower, 37k for 2-f and 55k for 1-f mode. This is likely because OPERA interpolates the spectra to get a sub-pixel wavelength step while DRAGRACES just does a single step per pixel.
Throughput and Sensitivity
We present here measured sensitivity and throughput of GRACES. Note that this was obtained after the GRACES fiber was installed permanently in the ESPaDOnS spectrograph at CFHT in preparation for the 2015B semester (GRACES Phase II), and represents current performance. Note that this performance shows a clear improvement compared to what was presented for GRACES phase I.
We define sensitivity as the magnitude of an object that would provide a signal-to-noise ratio (S/N) of 1 for an hour of integration time. To calculate the signal-to-noise ratio, we measured the signal (S) from 60sec observations of the spectrophotometric standard star Feige 66. Those observations were obtained under pristine weather conditions, with a photometric sky and seeing close to 0.5 arcsec. The air mass at the time of the observation was 1.114, so the resulting spectrum was corrected to an air mass of 1.0 using extinction values (magnitude per air mass) from Béland (1988). The spectrum was also binned into the resolution element, i.e. 1.7 pix and 2.9 pix for the 1 fiber and the 2 fiber mode, respectively, so the final result is presented as a function of resolution element.
We determined the noise level from a subtracted pair of 1200sec frames on sky, observed shortly after the Feige 66 spectrum. Using a spectra region generally free of sky lines and artifacts, the noise (N) is determined by multiplying the average standard deviation in the background counts by the square root of the aperture area used to extract the signal. We then have:
,
where TFeige66 and Tsky are the exposure time of the Feige 66 spectrum and the sky, respectively. To find the sensitivity, the signal-to-noise ratio (S/N1hr) is converted to a magnitude and added to the Feige 66 spectrum calibrated in magnitude (MFeige66) available from Massey et al. (1998, ApJ, 328, 31):
.
Here is the resulting GRACES sensitivity for both modes:
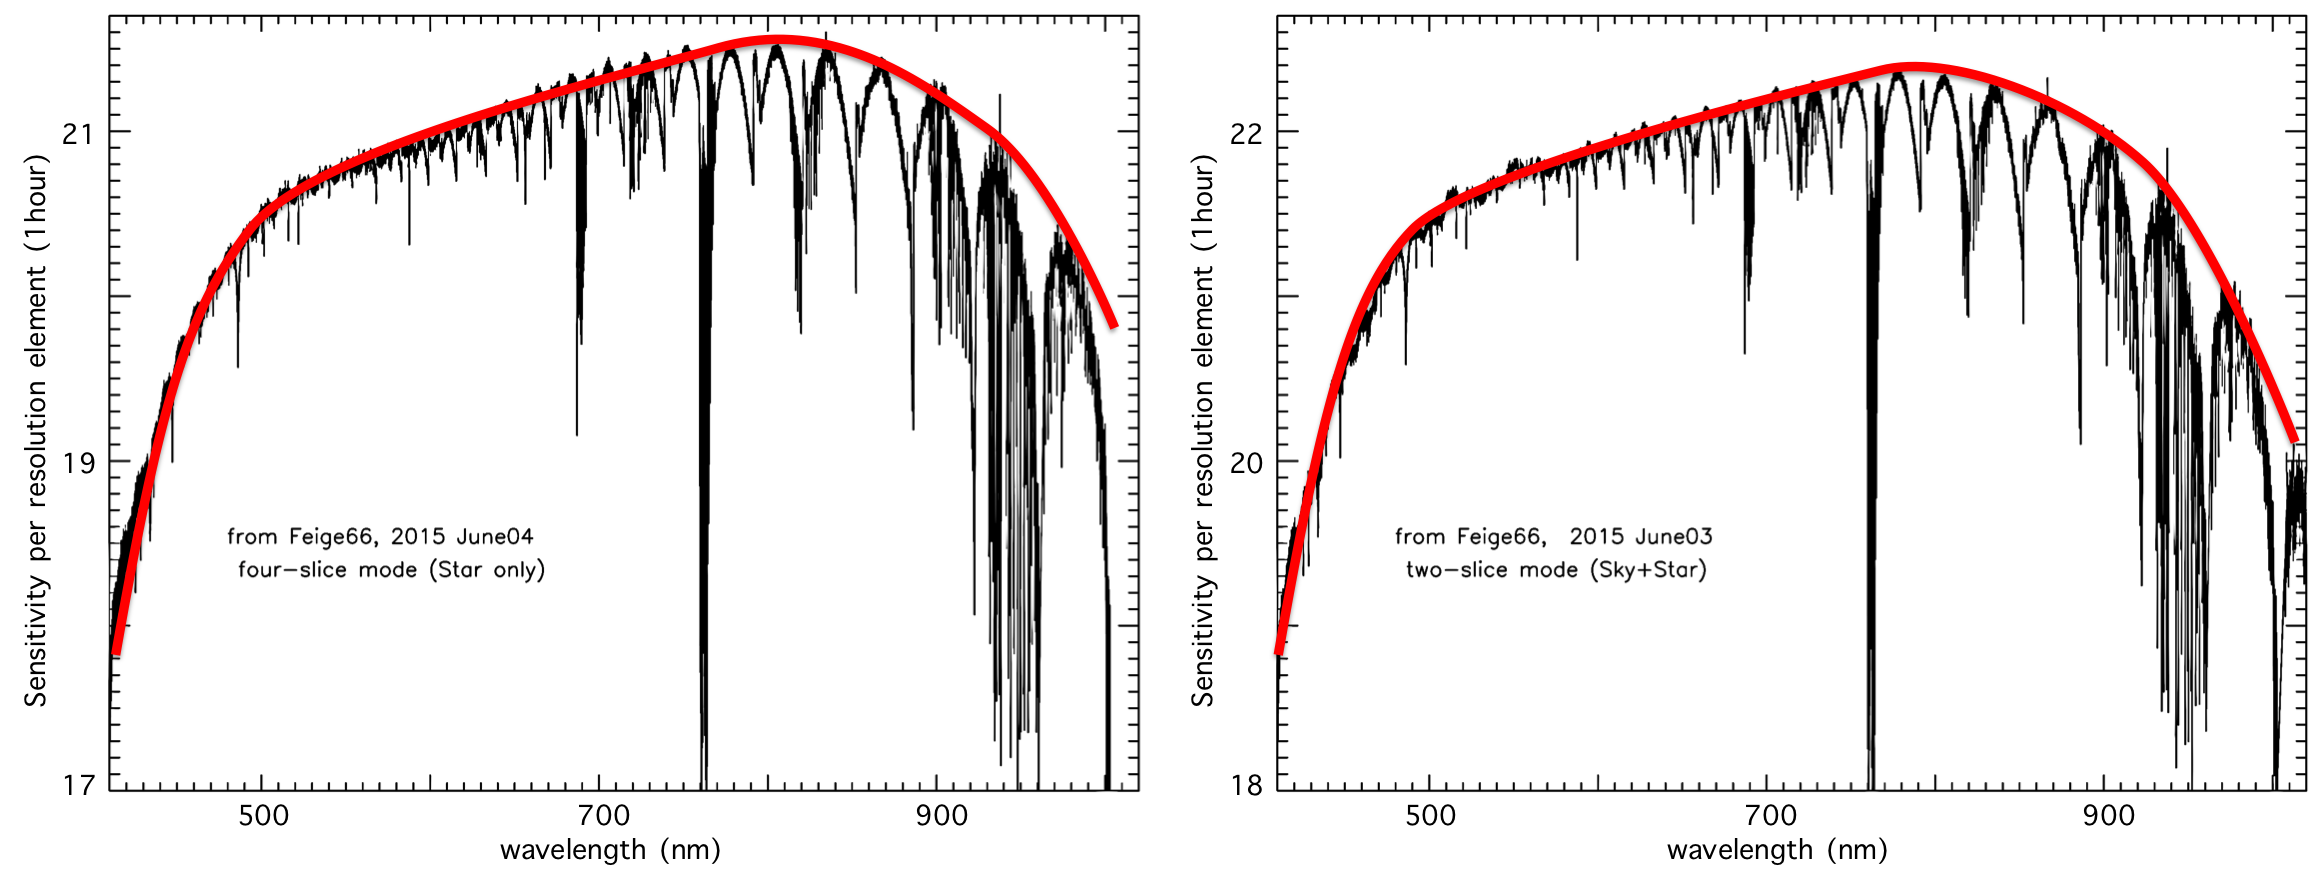
GRACES can deliver a S/N of 1 in 1 hour for a target as faint as 22.4 mag in the 2 fiber mode (two-slice mode) under IQ20%, CC50% weather conditions. Note that this result would be different if GRACES were used under poorer weather conditions. The sensitivity would drop to 22.1 mag under IQ70%, 21.8 mag under IQ85%, and 20.9 mag under IQany due to the 1.2arcsec diameter of the fiber. The sensitivity is also affected by the extend of the cloud cover, due to increased source extinction, resulting in a value of 22.1 mag under CC70%, 21.4 mag under CC80% and brighter than 20.4 mag under CCany and IQ20% (see extinctions for the different cloud cover percentile here). In the 1 fiber mode (four-slice mode), GRACES can deliver a S/N of 1 in 1 hour for a target as faint as 21.4 mag.
We determined system throughput based on the same Feige 66 observations that were used for sensitivity. We compared the measured flux with that from a standard Feige 66 spectrum calibrated to the flux of photons hitting the primary mirror. This standard spectrum comes from Hubble space telescope observations (SFeige66) available in the literature (Oke 1990, AJ, 99, 1621) to which we apply a coefficient to correct for the atmosphere extinction. In summary:
,
where
,
where μ is the air mass and Aλ is the extinction coefficient from Béland (1988).
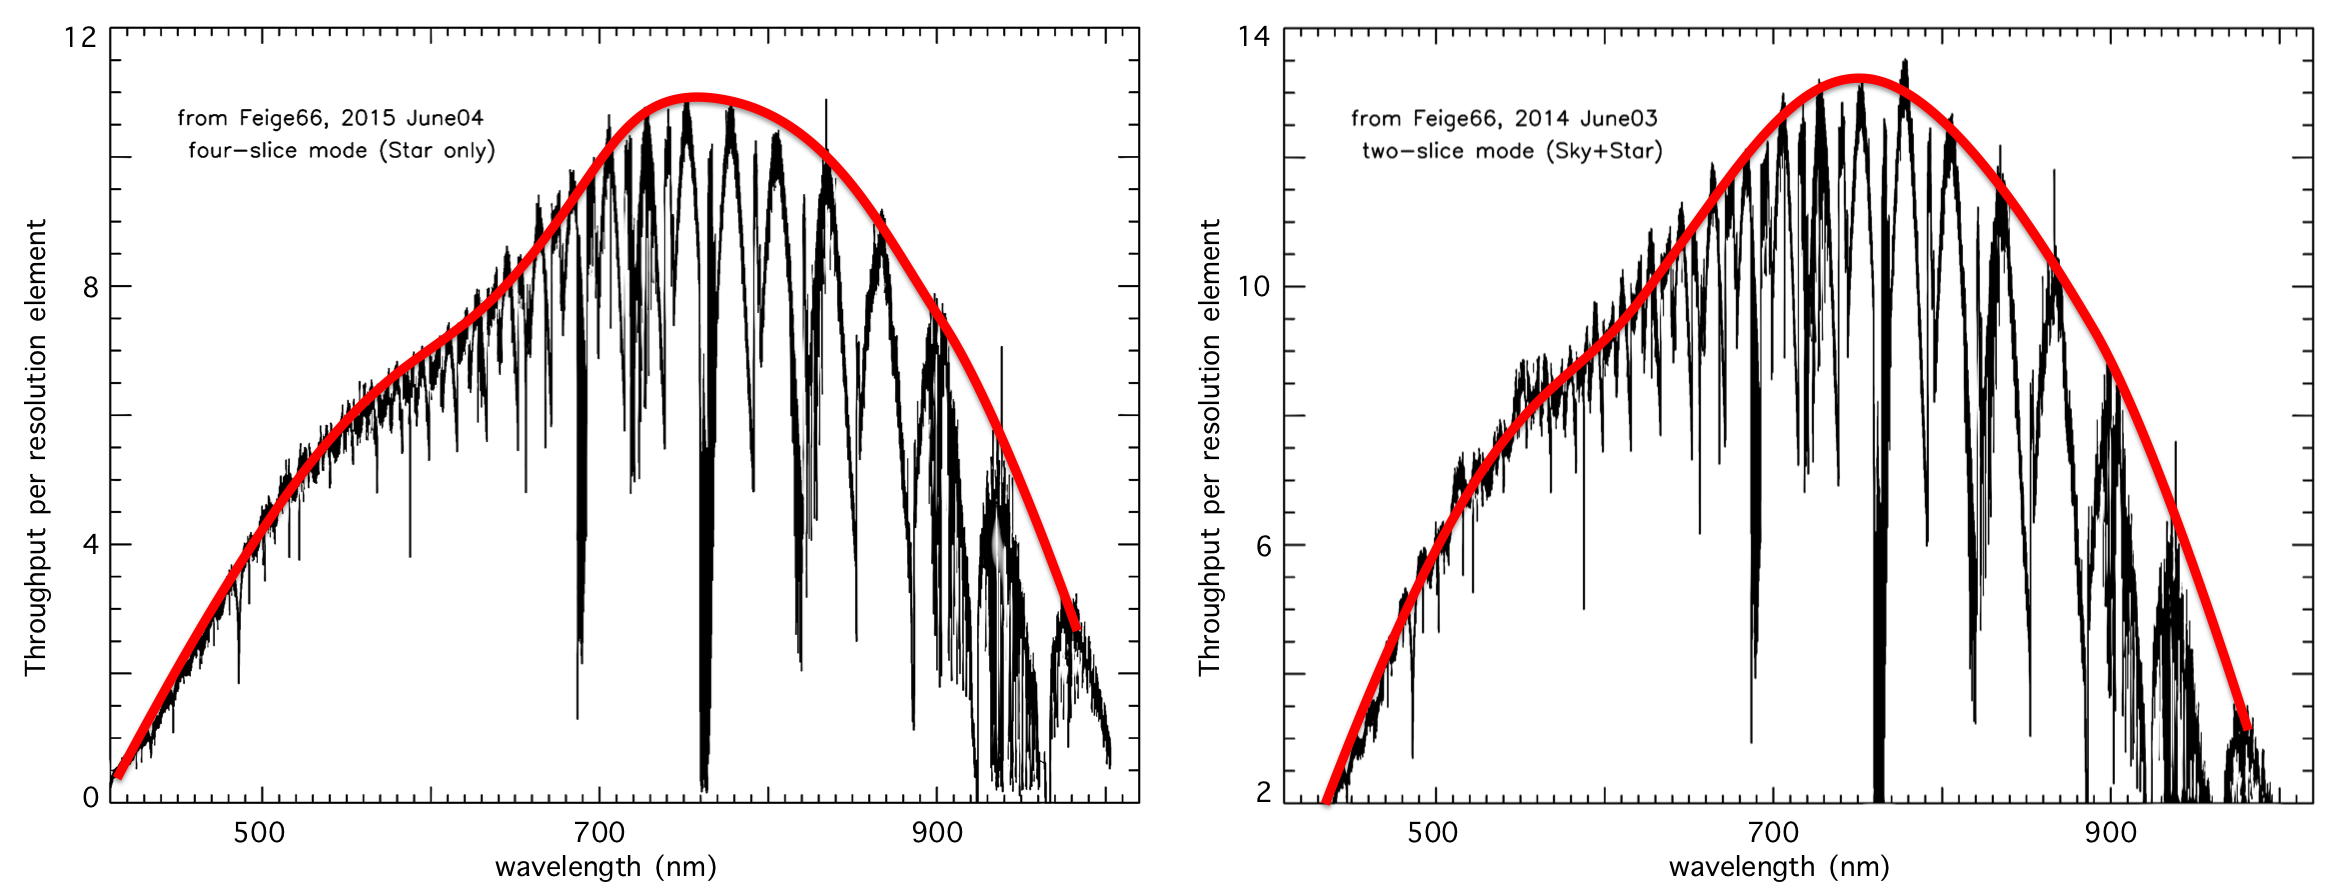
Our results show that 10-14% of the photons with wavelength between 600-800 nm that hit the Gemini North mirror get to the ESPaDOnS detector in the 2 fiber mode. In the 1 fiber mode, the same amount of light gets to the detector, but since the resolution element is smaller, we get values of 8-11%.
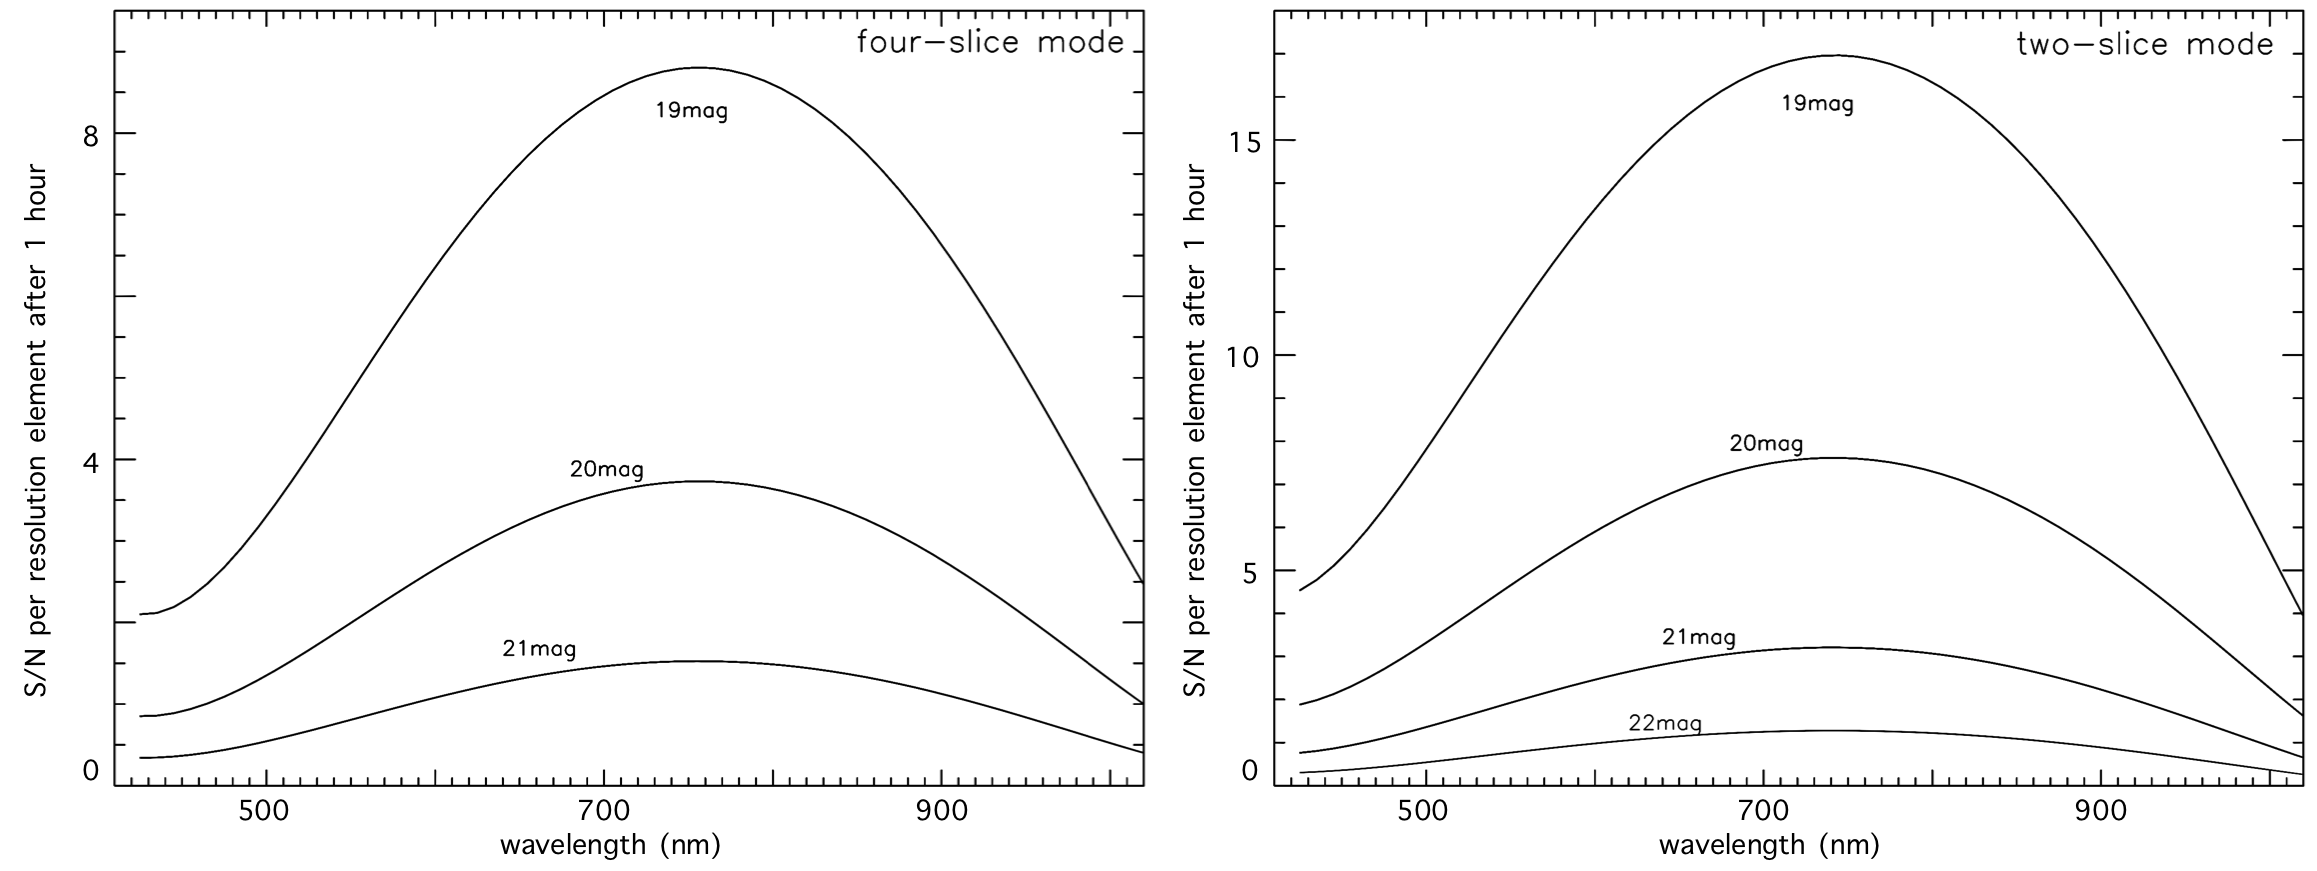
We can translate these results into the S/N one should expect for their observation. To give an idea of GRACES performance in both spectroscopic mode, here is the S/N reached for a flat spectrum of different magnitudes after a 1 hour exposure in the 1 fiber (left) and the 2 fiber (right) modes:
These results can be compared with the performance of other high-resolution spectrographs on 8-10m telescopes. Here is the S/N obtained after a 1 hour observation of the star Feige 66 with GRACES (2 fiber mode, in black), HIRES (in green) and UVES (in blue):
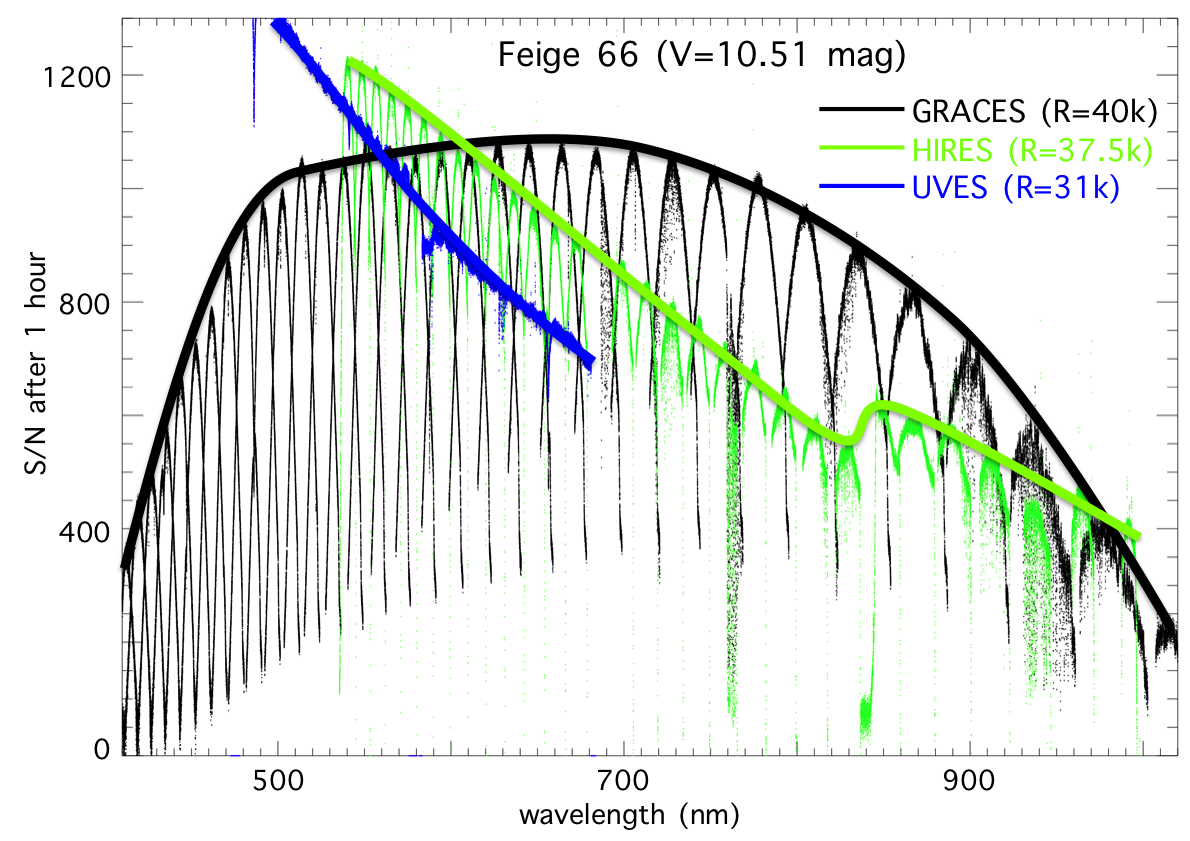
One can see that all spectra are comparable. The HIRES and UVES spectra were modified to correspond to the GRACES resolution and the weather conditions when the GRACES spectrum was observed. More details about this comparison can be provided by the instrument team upon request.
You may be interested also to read about the effect of Atmospheric Differential refraction (GMOS page).
Guiding Options
The guiding is performed on the Gemini-North telescope side. Therefore, the guiding options are the same as for GMOS-N; i.e., two guiding options are available, the GMOS On-Instrument Wavefront Sensor (OIWFS) and the telescope's Peripheral Wavefront Sensors (PWFSs). It is strongly recommended that the GMOS OIWFS be used for all but non-sidereal objects. This is because there is significant flexure between GMOS and the PWFSs.
Polarimetry
The spectropolarimetric mode IS NOT OFFERED with GRACES.
ESPaDOnS' polarimetric device is at the Cassegrain focus of the CFHT telescope. Therefore, the polarization of the beam is analyzed before it enters ESPaDOnS' spectrograph. To do the same with GRACES, the light would have to be analyzed with a polarimetric device in the Gemini telescope instrument support before it is sent into the long 270m fibers.
Gemini-North telescope does have a polarimeter device called GPOL for analyzing the Stokes U and Q parameters. However, it is not yet commissioned and none of the Gemini instruments is currently equipped with a Wollaston prism.
