
International Gemini Observatory/NOIRLab/NSF/AURA
Phased X-ray light curve and radial velocity curve for M33 X-7
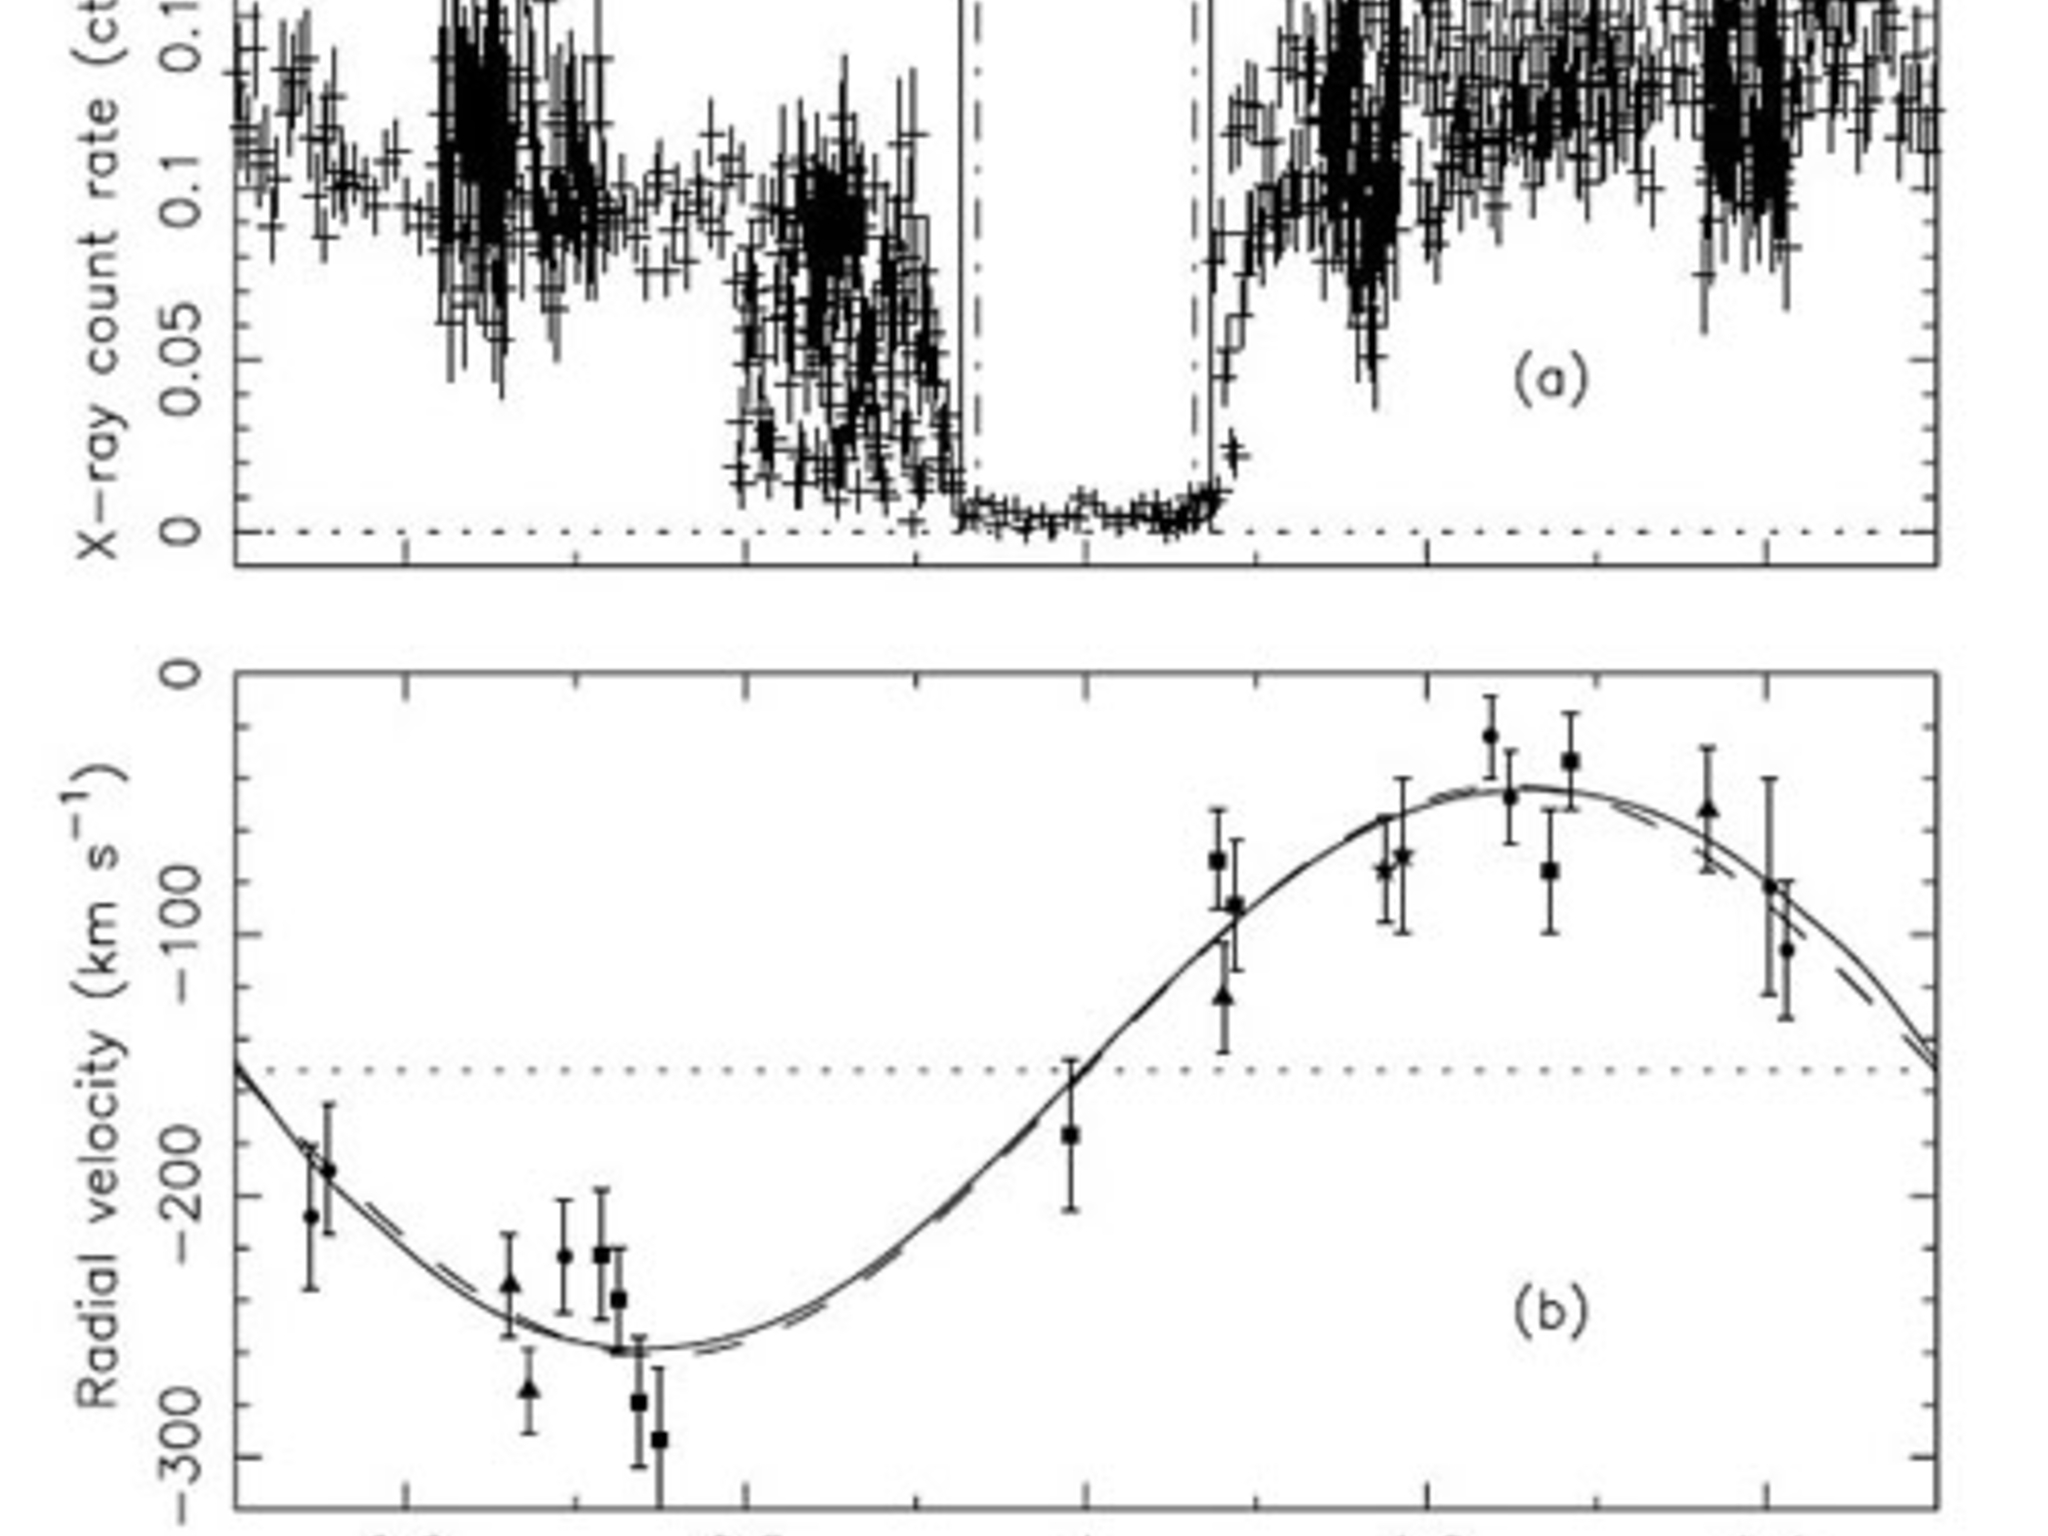
Phased X-ray light curve and radial velocity curve for M33 X-7. (a) The Chandra ACIS light curve in the 0.5 − 5 keV energy band. (b) The radial velocity curve derived from the Gemini spectra (extracted using the GMOS IRAF package) with the best-fitting model shown as a solid line. The error bars 1σ (s.d.) statistical. The dashed line is the best-fitting sinusoid.