Announcements
Slit Spectroscopy
GNIRS has two basic slit spectroscopy modes.
- Long slit, 1.0-5.4 µm spectroscopy of any individual window (X, J, H, K, most of L, or M) at R up to ~1,800, or of any portion thereof at R up to ~18,000; either without adaptive optics or with adaptive optics (XJHKL only), using slit lengths of 50-100 arc-seconds.
- Cross-dispersed, 0.85-2.5 µm short slit spectroscopy with full spectral coverage at R up to ~1,800 and partial coverage (disjoint 0.1-0.2 µm segments) at R up to ~6,000; with or without adaptive optics, using slit lengths of 5-7 arc-seconds.
Note: The sensitivity in a single order in cross-dispersed mode is reduced by about 10% compared to the sensitivity in long slit (single order) mode. Unless the science specifically involves only one order of GNIRS (e.g., J, H, or K) or the source size is more than 2-3 arc-seconds (requiring nodding to sky) it is advantageous to employ the cross-dispersed mode.
The GNIRS grating turret contains three gratings, each with an effective first order blaze wavelength of 6.6 µm. The wavelength diffracted with peak efficiencies then correspond fairly well to the atmospheric windows centered at 5, 3.5, 2.2, 1.65, and 1.25 µm (M, L, K, H, J) for orders 1 through 5 respectively. The blocking filters used for these orders cover most or all of the free spectral ranges of the individual orders. A filter for order 6 (1.1 µm, called X) is also available.
The coverages and resolving powers provided by the gratings are tabulated below for the short (0.15"/pix) and long (0.05"/pix) blue and red cameras. The blue cameras are used in the XJHK bands, the red cameras in the LM bands. The resolving powers (λ / Δλ) in the table are for 2-pixel wide slits. Wider slits are available, see the list of slits. Note that the wavelength coverage within an order does not depend on the central wavelength setting, and that the resolving power within an order increases with wavelength. Note also that the resolving power depends is proportional to 1/(slit width) for sources that fill the width of the slit; the values of R in the table are for the 0.3" slit with the short cameras and for the 0.10" slit with the long cameras and are the highest ones achievable.
| Grating (l/mm) |
Order - Band | Blocking Filter Range (microns) | Short camera (0.15"/pix), 0.30" slit | Long camera (0.05"/pix), 0.10" slit | ||
| Coverage (microns)(a) | Resolving power (2 pix wide slit)(b,c) |
Coverage (microns)(a) | Resolving power (2 pix wide slit)(b,c) |
|||
| 10.44 | 6 - X (1.10µm) | 1.03-1.17 | (d) | (d) | 0.332(f,g) | ~2,100 |
| 10.44 | 5 - J (1.25µm) | 1.17-1.37 | (d) | (d) | 0.398(f,g) | ~1,600 |
| 10.44 | 4 - H (1.65µm) | 1.47-1.80 | (d) | (d) | 0.497(f,g) | ~1,700 |
| 10.44 | 3 - K (2.20µm) | 1.91-2.49 | (d) | (d) | 0.663(f,g) | ~1,700 |
| 10.44 | 2 - L (3.50µm) | 2.8-4.2 | (d) | (d) | 0.995 | ~1,800 |
| 10.44 | 1 - M (4.80µm) | 4.4-6.0(i) | (d) | (d) | 1.99(e) | ~1,200 |
| 31.7 | 6 - X (1.10µm) | 1.03-1.17 | 0.331(f,g) | ~1,700(h) | 0.110(i) | ~5,100 |
| 31.7 | 5 - J (1.25µm) | 1.17-1.37 | 0.397(f,g) | ~1,600(h) | 0.132(i) | ~4,800 |
| 31.7 | 4 - H (1.65µm) | 1.49-1.80 | 0.496(f,g) | ~1,700(h) | 0.166(i) | ~5,100 |
| 31.7 | 3 - K (2.20µm) | 1.91-2.49 | 0.661(f,g) | ~1,700(h) | 0.221(i) | ~5,100 |
| 31.7 | 2 - L (3.50µm) | 2.80-4.20 | 0.992 | ~1,800 | 0.332 | ~5,400 |
| 31.7 | 1 - M (4.80µm) | 4.4-6.0(j) | 1.98(e) | ~1,240 | 0.660 | ~3,700 |
| 110.5 | 6 - X (1.10µm) | 1.03-1.17 | 0.094(i) | ~6,600 | 0.0316 | ~17,800 |
| 110.5 | 5 - J (1.25µm) | 1.17-1.37 | 0.113(i) | ~7,200 | 0.0380 | ~17,000 |
| 110.5 | 4 - H (1.65µm) | 1.49-1.80 | 0.142(i) | 5,900 | 0.0475 | ~17,800 |
| 110.5 | 3 - K (2.20µm) | 1.91-2.49 | 0.189(i) | ~5,900 | 0.0633 | ~17,800 |
| 110.5 | 2 - L (3.50µm) | 2.80-4.20 | 0.280 | ~6,400 | 0.0944 | ~19,000 |
| 110.5 | 1 - M (4.80µm) | 4.4-6.0(j) | 0.575 | ~4,300 | 0.192 | ~12,800(k) |
Notes:
(a) Important: Wavelength coverages are accurate to +/-2 percent. Wavelength is linear with array pixel number. Actual wavelength settings (specified in the OT by the central wavelength) are accurate to better than 5 percent of the wavelength coverage. E.g., if the requested setting with the 110.5 l/mm grating and short camera has a central wavelength of 3.700 µm, the nominal spectral range delivered will be 3.560 - 3.840 µm, but could be shifted by as much as 0.014 µm either way. Should an observing program require higher accuracy than the above, a note should be added at phaseII.
(b) Values are for the wavelengths in column 2. Values are linear with wavelength within an order; for example, for the 31.7 l/mm grating and the short camera R~1550 at 3.0µm and R~2050 at 4.0µm.
(c) Resolving power depends on 1/(slit width) for sources that fill the slit width; for example, the values of R for a 3 pixel-wide slit are 2/3 the values in the table.
(d) This mode potentially provides R=570 but offers no advantage over R=1700 and is not used in practice.
(e) Not recommended; the next higher resolution grating covers almost the entire accessible wavelength range in the M window and can be used with longer exposure times and significantly lower overheads.
(f) When used in single order (long slit) mode wavelength coverage is broader than bandpass of the blocking filter.
(g) When used with a cross-dispersing prism a complete 0.8-2.5µm spectrum is obtained across five orders (3-8).Efficiency in orders 7 and 8 is low.
(h) Since November 2012 and for the cross-dispersed mode with the 2 pix wide slit only resolving powers are somewhat lower, as follows: X-1400; J-1400, H-1400; K-1300. For cross-dispersion with other slit widths use the table and footnote c.
(i) When used with a cross-dispersing prism 0.1-0.2µm disjoint sections of the 0.9-2.5µm spectrum are obtained in the five orders (3-7). 3-4 wavelength settings are required to provide complete wavelength coverage
(j) Detector does not respond to light at wavelengths greater than 5.4 microns.
(k) Resolving power significantly lower than in other orders (because grating angles corresponding to M band in first order are significantly less than the angles of other bands in their orders).
Spectroscopic Modes
Long-slit
In the long-slit (single order) mode one band (e.g., X, J, H, K, L, or M) is observed at a time along a 99 arcsec (short camera) or 49 arcsec (long camera) slit. At the lowest resolution (31.7 l/mm grating and short cameras or 10.44 l/mm grating and long cameras), the usable wavelength coverage for a single order usually is limited by the order-blocking filter rather than by the size of the detector array. At higher resolution (e.g., 111 l/mm grating and either camera) only a (selectable) portion of the filter bandpass is observed. There is some inter-order contamination at the shortest wavelengths, as described below for the case of R~1800.
The long cameras are generally used only if (1) high angular resolution provided by adaptive optics (AO) is a scientific requirement and/or if (2) the highest spectral resolution (provided by the 110.5 l/mm grating and a narrow slit) is a scientific requirement. The use of a narrow slit without AO (e.g., when observing very bright stars or observing in the thermal IR) results in large light loss.
|
Grating/Camera configurations: |
32 l/mm grating and short cameras or 10 l/mm grating and long cameras |
|
Resolving power: |
1800 either with short cameras and 0.3 arcsec wide slit or with long cameras and 0.1 arcsec wide slit. Lower resolving powers if wider slits are used. |
|
Typical uses: |
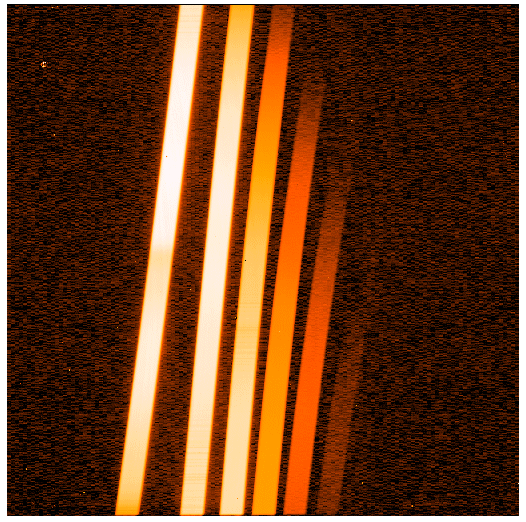
Spectrum of all or most of an atmospheric window or filter passband as defined by the blocking filter (X, J, H, K, L, or M) at one grating setting with 99 arcsec long slit The minimum usable wavelength for long slit spectroscopy is ~1.03um observed in 6th order. Use the cross-dispersing prism for wavelengths shorter than 1.03 microns. In addition, the wavelength ranges 1.37-1.47, 1.82-1.91, and 2.49-2.56 microns are not covered by the blocking filters; they can only be observed in cross-dispersed mode. When viewing an X band spectrum, signal at apparent wavelengths shorter than 1.00 um is from 5th order at the long wavelength end of the X filter; likewise signal at wavelengths greater than 1.18 microns is the 7th order spectrum at the short wavelength end of the X filter. Likewise, in the J band (5th order) signal at apparent wavelengths below 1.15 microns is actually 4th order light near 1.4 microns; likewise the spectrum apparently beyond 1.40 microns is 6th order light near 1.2 microns. In the H band (order 4) the spectrum beyond an apparent wavelength of 1.85 microns is the 5th order spectrum at the short wavelength end of the H filter. Note also that the spectral coverage in the L window is "only" 0.99 microns, and thus the full window cannot be covered in one grating setting. For example, two setting would be required to cover both the water ice band near 3.0 microns and the Br alpha line at 4.05 microns. Large observing overheads mean that the 32 l/mm grating and short red camera should generally not be used for M band spectroscopy. Use the 111 l/mm grating instead. See the example spectra shown below of an A-type star: 5th order (J, 1.25um), 4th order (H), 3rd order (K), 2nd order (L, 3.4um), and 2nd order (L, 3.8um), |
|
Grating/Camera configurations: |
110 l/mm grating with short cameras or 32 l/mm grating with long cameras |
|
Resolving power: |
~5900 with 0.3 arcsec wide slit and either short camera or with 0.1 arcsec wide slit and either long camera. Lower resolving powers if wider slits are used. |
|
Typical uses: |
(1) Intermediate resolution spectra with 99 arcsec slit and short cameras or 49 arcsec slit and long blue camera (with or without AO). Can be used for observing at high sensitivity between the OH sky emission lines at 0.9-2.3um or between sky absorption lines at longer wavelengths) Minimum recommended wavelength is ~1.03 microns as with the 32 l/mm grating, and a few other narrow wavelength intervals are inaccessible (see details). Wavelength coverage is about one third of that with the 32 l/mm grating and so,with the exception of the M band, two or more settings are required to cover each atmospheric window. While two settings are required for the "full" M window, a single setting of 4.50-5.16um covers 3/4 of the window starting at the short wavelength edge, and the remaining portion of the window (5.16-5.40um) has very poor transmission even on the driest Mauna Kea nights. Observing at this intermediate resolution in the M band is considerably more efficient than with the 32 l/mm grating and short camera, because the sky and telescope background are reduced and the array does not need to be read out as frequently. Spectra obtained at example grating settings are shown below of an A-type star with central wavelength: 1.27um (5th order), 1.66um (4th order), 2.14um (3rd order), 3.79um (2nd order), 4.7um (1st order). |
|
Grating/Camera configurations: |
110 l/mm grating and long cameras |
|
Resolving power: |
~18,000 with 0.1 arcsec (2 pixel) slit in all but the M band, where R~13,000. Lower resolutions with wider slits |
|
Typical uses: |
(1) High resolution spectra with 49 arcsec long slit This mode provides the highest spectral resolution obtainable with GNIRS. Narrow slits are required to achieve high resolution and if AO is not used, slit losses are large. Wavelength coverage is about one-third of that with the long camera and the 32 l/mm grating (or the short camera and the 110 l/mm grating). Many grating settings would be required to cover an atmospheric window in this mode, with large overheads due to taking calibrations at each wavelength setting before moving the grating. Users thinking about this kind of observation are recommended to consider using the cross-dispersed mode instead. Spectra of a K1 giant (BS6913) obtained at example grating settings are shown below, with central wavelengths 1.63um (4th order) and 2.22um (3rd order). |
Cross-dispersed
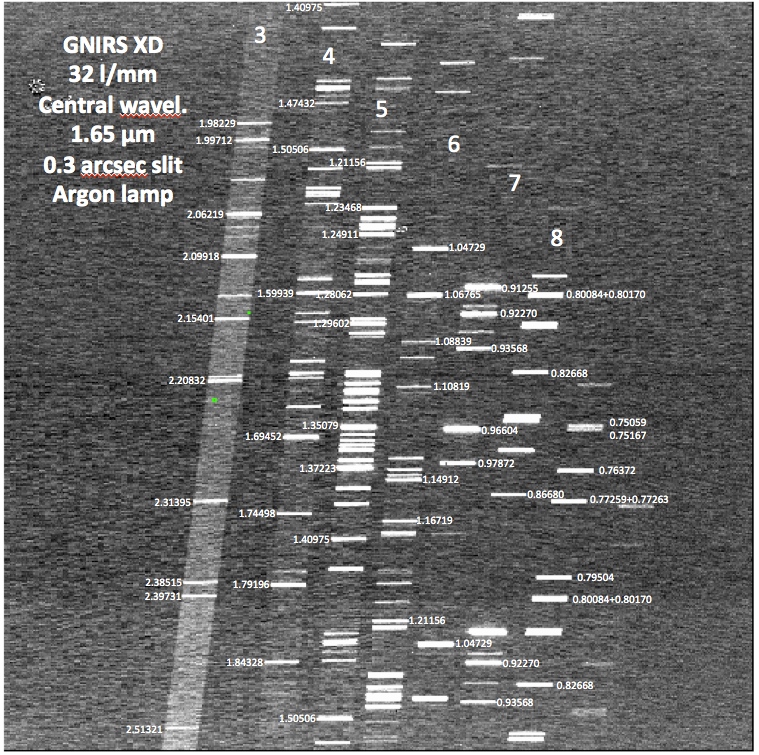
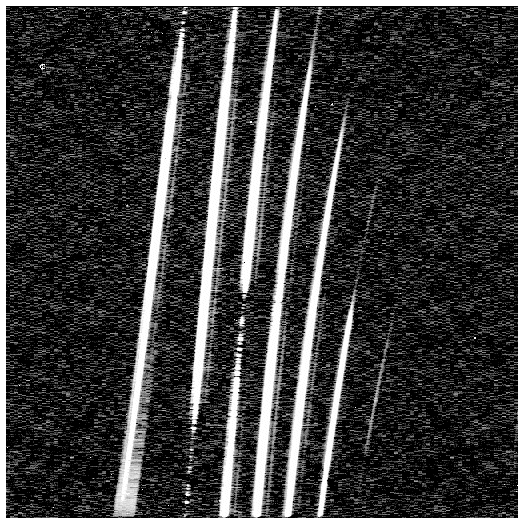
In the cross-dispersed (multi-order) mode at the lowest spectral resolution (R~1800 for the 0.3 arcsec wide slit (short camera) and for the 0.1 arcsec wide slit (long camera)), the entire 0.85-2.5 µm region (orders 3-8) is observed with a single grating setting and without inter-order contamination. (Orders 9-11 also fall on the array but the transmittance of GNIRS drops steeply in these orders.) Two configurations can be used to achieve this wavelength coverage: the 32 l/mm grating and short blue camera with the short camera's cross-dispersing prism (SXD) and a 7" slit, or the 10 l/mm grating, long blue camera, long camera cross-dispersing prism (LXD) and 5" slit. Short slits must be used to prevent overlapping orders on the detector array. The 10 l/mm grating and long camera may also be used with the SXD prism, allowing a longer slit (7") but restricting the wavelength coverage to 1.2-2.5 µm (orders 3-5).
At intermediate resolution (111 l/mm grating and short camera or 32 l/mm grating and long camera) approximately one-third of each order is observed and 3-4 grating settings are required to obtain complete 0.85-2.5 µm coverage.The resolving power is ~5400 for the 0.3 arcsec wide slit (short camera) and for the 0.1 arcsec wide slit (long camera).
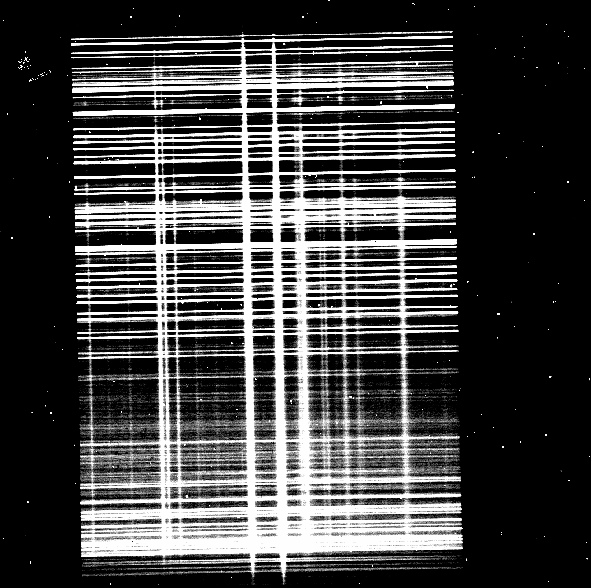
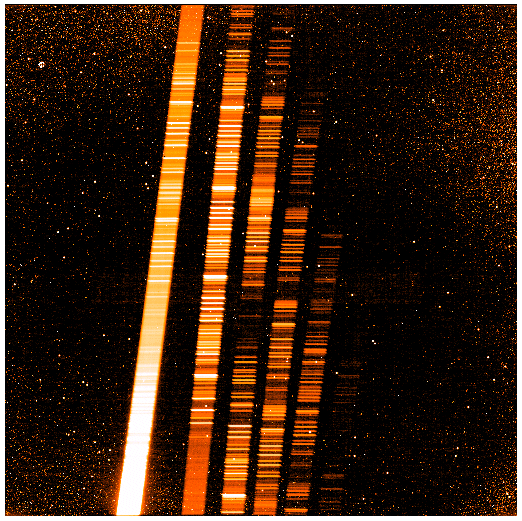
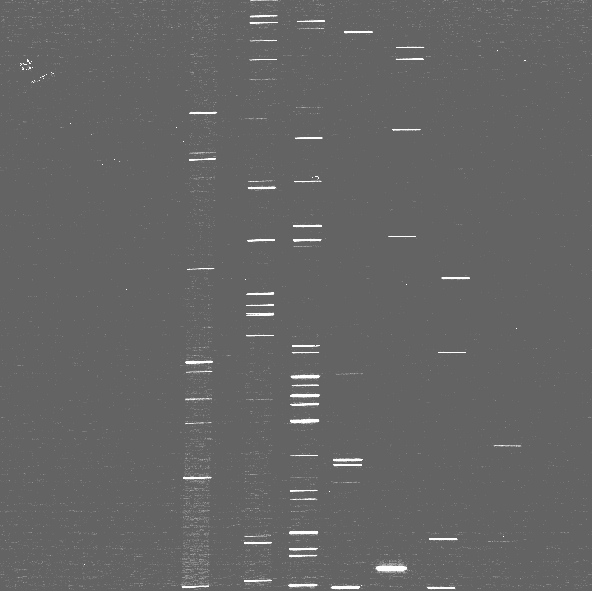
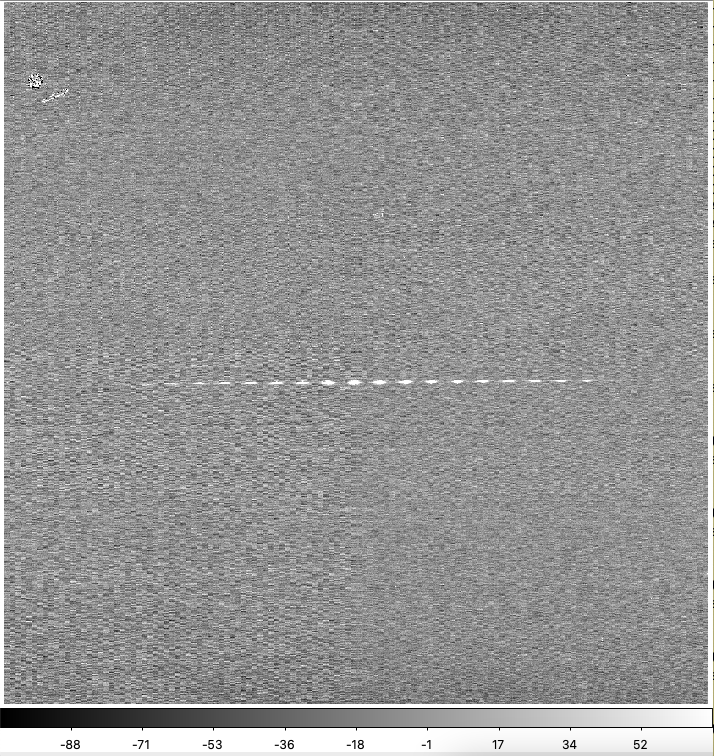
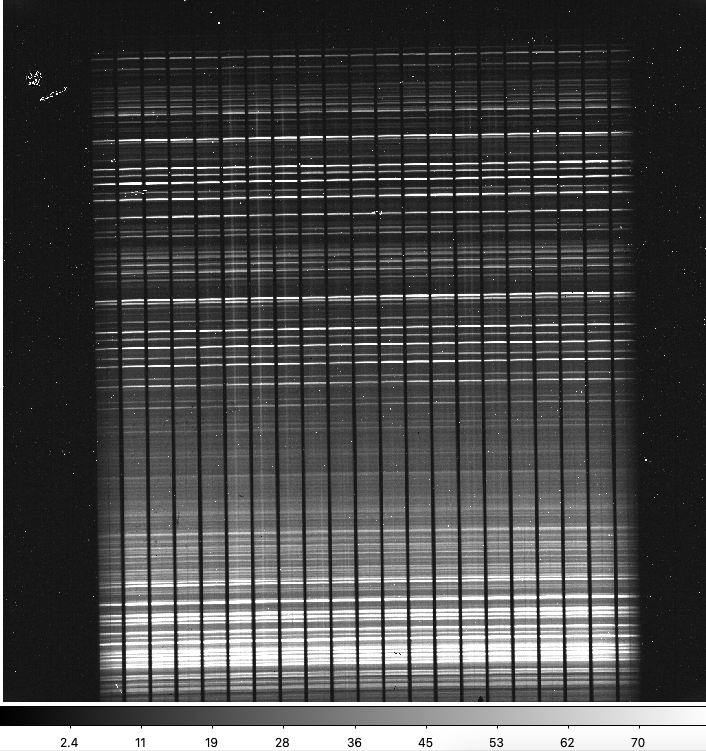
The figures below show examples of cross-dispersed data (obtained with the 32 l/mm grating and the short blue camera).
|
Grating/Camera configurations: |
32 l/mm grating and short blue camera or 10 l/mm grating and long blue camera |
||
|
Resolving power: |
1800 either with with short blue camera and 0.3 arcsec wide slit or with long blue camera and 0.1 arcsec wide slit. Lower resolving powers if wider slits are used. |
||
|
Typical uses: |
Full coverage 0.85-2.5µm spectra in short slits: 7 arcsec long for the 32 l/mm grating, short blue camera and its (SXD) prism; 5 arcsec long for the 10 l/mm grating, long blue camera and its (LXD) prism. There is no inter-order contamination. One can also use the long blue camera with the SXD prism and the 7 arcsec slit, but then the wavelength coverage is 1.2-2.5µm. The orders are positioned on the array so as to avoid the patches of bad pixels. The short slits are sufficiently long that for point-like sources it is possible to nod the telescope while keeping the source in the slit and thus obtain sky subtracted-spectra for which the source is observed 100 percent of the time. For sources larger than a few arc-seconds it is necessary to nod the telescope to blank sky.
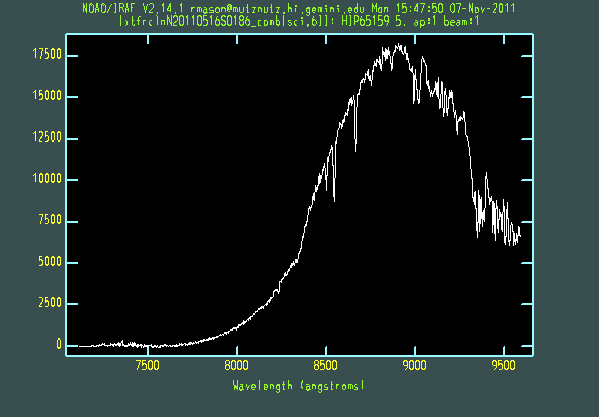
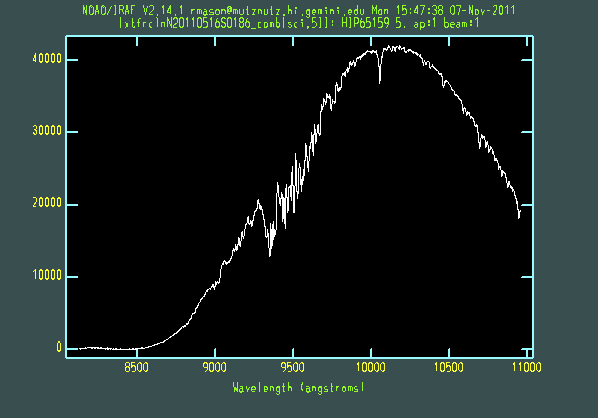
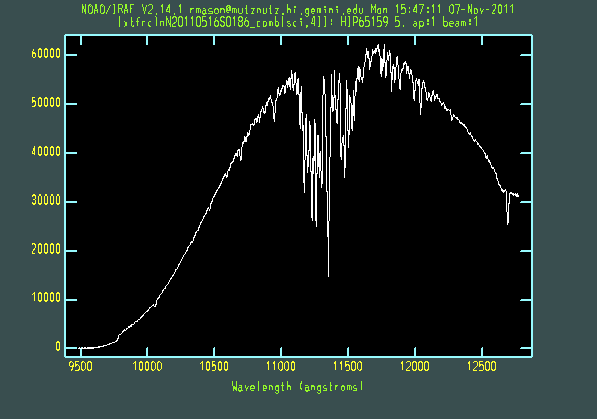
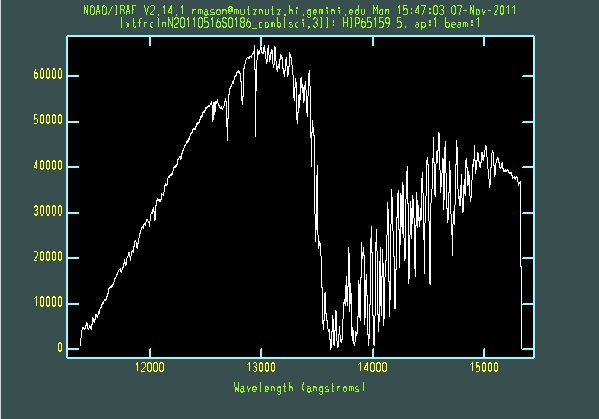
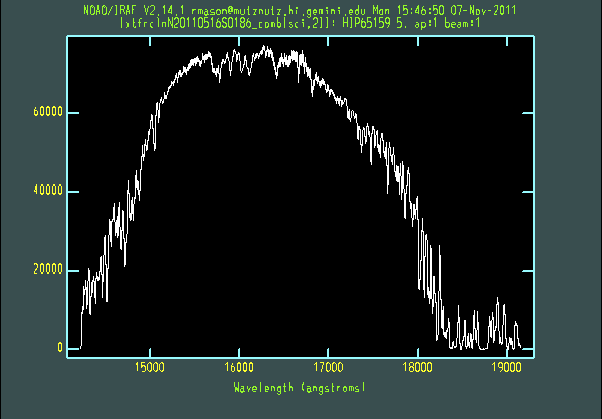
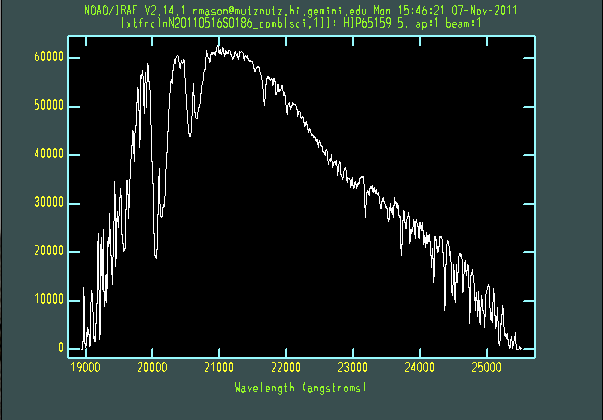
Reduced spectra of a standard star in orders 3 through 8 covering 0.85 to 2.5 microns are shown below. Click on each spectrum to enlarge. |
|
Grating/Camera configurations: |
110 l/mm grating with short blue camera or 32 l/mm grating with long blue camera |
||
|
Resolving power: |
5900 with 0.3 arcsec wide slit and short blue camera or with 0.1 arcsec wide slit, long blue camera, and adaptive optics. Lower resolving powers if wider slits are used. |
||
|
Typical uses: |
(1) Intermediate resolution spectra of selected portions of orders 3-8 (between 0.85µm and 2.5µm in short slits as described in XD R<1800 mode. Can be used for observing at high sensitivity between OH sky emission lines at 0.9-2.2µm or between sky absorption lines at 2.25-2.5µm. The wavelength coverage is about one-third of that of the low resolution mode (e.g., short camera + 32 l/mm grating) and so three or more settings are required to obtain full wavelength coverage at 1-2.5µm. The positioning of the orders depends on the grating central wavelength, so in some grating settings one order may cross the small central patch of bad pixels. If this is likely to pose a problem the user should contact a member of the GNIRS science team. We have noticed contamination in observations that use the GNIRS configuration: Short Blue camera + 111 l/mm grating + SXD cross disperser. More information about this effect is available here. If this is likely to pose a problem the user should contact a member of the GNIRS science team.
|
|
Grating/Camera configurations: |
110 l/mm grating with long blue camera |
|
Resolving power: |
~17000 with 0.1 arcsec wide slit and long blue camera. Lower resolving powers if wider slits are used. |
|
Typical uses: |
(1) High-resolution resolution spectra of very small portions of orders 3-8 (between 0.85µm and 2.5µm in short slits as described in XD R<1800 mode. Contact your NGO or a member of the GNIRS science team if you are interested in using this mode. |
Integral Field Spectroscopy
Low Resolution IFU
The LR-IFU takes a rectangular input field of 3.15" x 4.80" and split it in 21 slices of width 0.15". By re-arranging the slices end-to-end at the detector like a normal long-slit, the LR-IFU allows images to be dispersed into full-length spectra (covering one band, i.e., X, J, H, or K, with the short blue camera) while preserving the complete 2-D spatial information. The coverages and resolving powers provided by the gratings matches those tabulated for the short (0.15"/pix) cameras for the 2-pixel wide slits here.
The throughput of the LR-IFU is roughly 70% (X-band), 72% (J-band), 78% (H-band) and 85% (K-band) of the nominal 0.15"-wide long-slit throughput, though keep in mind that slit losses inherent to observations utilizing a 0.15"-wide long-slit do not apply for the LR-IFU in the central regions of the array. Note that the end slices are partially vignetted as expected (and presented in the original design) due to the larger size of the IFU with respect to the long-slit. The two end slices transmit ~35-55% as much light as the rest of the field. The central 19 slices have relatively uniform throughout (+/- 5% across the field).
The LR-IFU is designed to sample the 20th percentile PSF obtained with just tip-tilt correction from the telescope secondary using the short cameras. It is possible to take LR-IFU observations using Gemini-N's "super-seeing" mode (LGS+PWFS1). However, the LGS corrected PSF may be undersampled at the 0.15" per pixel scale of the LR-IFU.
High Resolution IFU
The HR-IFU takes a rectangular input field of 1.25" x 1.80" and split it in 25 slices of width 0.05". By re-arranging the slices end-to-end at the detector like a normal long-slit, the HR-IFU allows images to be dispersed into spectra while preserving the complete 2-D spatial information. The wavelength coverage and resolving power of the HR-IFU provided by various gratings matches those tabulated for the short (0.05"/pix) cameras for the 2-pixel wide slit here.
The throughput of the HR-IFU is roughly 80% in the X band, and 90% in the J through M bands of the equivalent throughput of a 0.05"-wide long slit (as measured using the 0.1"-wide long slit). Though, keep in mind that slit losses inherent to observations utilizing a 0.1"-wide long slit do not apply for the HR-IFU in the central regions of the array. The 25 slices have relatively uniform throughout (+/- 5% across the field) with the exception of the small area of the IFU that is affected by paint flakes on the pickoff mirror (see below).
The HR-IFU is optimized for fully adaptively corrected images and can be used in both traditional AO modes (NGS/LGS) and LGS + P1 (i.e., super-seeing) modes. If LGS+P1 mode is used, considerable care will be required in determining frequency of re-acquisitions, as the movement due to flexure is roughly one-third of the field of view of the short axis of the HR-IFU (~0.4") per 30 minutes of observations (see more details here). Blind offseting to a target is supported in LGS+P1 mode, but targets should be visible in individual science exposures to a level sufficient to be able to stack the frames at a common on-soruce spatial location. The HR-IFU will also fully sample the 20th percentile PSF obtained from the tip-tilt correction from the telescope secondary using the long cameras (0.35" FWHM in L- and M-band, see here).
In early May of 2023, several slices of the HR-IFU were affected by the flaking of Nextel paint onto the HR-IFU pickoff mirror due to mechanical wear on an oversized baffle. This baffle has since been removed, and it has been confirmed that the HR-IFU is not affected by additional scattered light, but several small (~100 micron-sized) paint flakes remain on the HR-IFU pickoff mirror. These flakes affect slices 1-5, 15, 16, and 21 and appear as horizontal bands of decreased flux in the X-K bands and increased flux in the L & M bands (due to their thermal emission). These flakes subtend roughly 10% of the affected slices and can be removed by dithering. Future work is planned to attempt to remove the flakes.
Imaging
GNIRS can be used for near-infrared (1.0-2.5µm + PAH at 3.3µm) imaging science and is in fact quite sensitive. However, as a photometer/imager it has the following limitations.
- The order-blocking filters have non-standard bandpasses. Only the H order-blocking filter approximates the Mauna Kea photometric filter for its band.
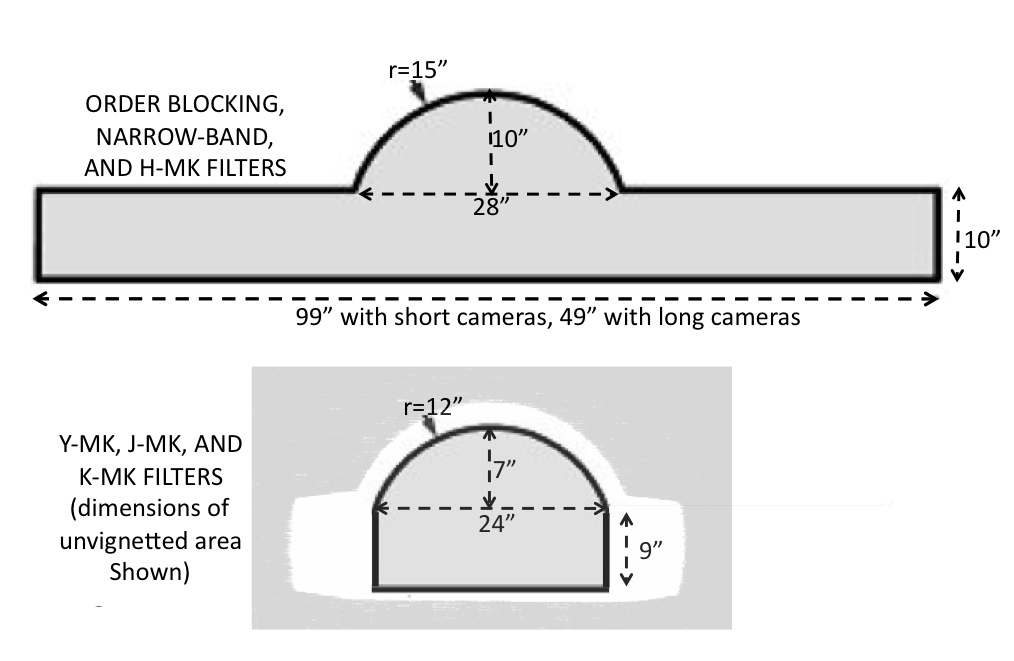
- For the order blocking and narrow band filters the field of of view is the acquisition "keyhole," whose dimensions are shown below. For the Y, J, and K Mauna Kea filters the un-vignetted field is much smaller, as also shown (the Observing Tool does not yet show this smaller field).
- Currently the best image quality that has been achieved by GNIRS + adaptive optics (ALTAIR) is ~0.12 arcsec (fwhm); this is twice the diffraction-limited fwhm in the K band.
Now that NIRI is no longer offered, GNIRS is the only NIR imaging option on Gemini-N. Users should be aware that the Gemini IRAF package contains no dedicated support for GNIRS imaging reductions. However, the keyhole imaging data reduction capability is included in DRAGONS.
The basic detector properties are given here. See also the known issues page. Approximate sensitivities and maximum exposure times (shallow well, except where noted) for imaging though several filters in GNIRS are given in the table below. Sensitivity values are for 0.15" pixels without AO; they are expected to be similar for 0.05" pixels with AO.
| GNIRS IMAGING SENSITIVITY IN GOOD SEEING AND WITH 0.15" PIXELS (S/N=5 IN 1 HOUR, N.I. OVERHEADS) |
|||
| Filter | Bandpass (µm) | Point Source magnitude | maximum exposure timea |
| Y (Mauna Kea) | 0.97-1.07 | 23.3 | 240 s |
| X (order blocking) | 1.03-1.17 | 23.9 | 50 s |
| J (Mauna Kea) | 1.17-1.33 | 23.5 | 90 s |
| J (order blocking) | 1.17-1.37 | 23.7 | 50 s |
| H (order blocking and Mauna Kea) | 1.49-1.80 | 23.0 | 10 s |
| K (Mauna Kea) | 2.03-2.37 | 22.6 | 30 s |
| K (order blocking) | 1.90-2.49 | 23.1 | 10 s |
| H2 | 2.105-2.137 | 21.1 | 300 s |
| PAH | 3.27-3.32 | 15.7 | 0.8 s (deep well) |
aMaximum exposure times to avoid saturation on the sky background. If these exposure times are used, low-level residual images of the acquisition field of view will be present in subsequent long exposures. PIs wishing to follow imaging with spectroscopy are advised to take this into account in choosing their exposure times.
Zero points
The filters listed below may be used for photometry on the Mauna Kea system. As they vignette the outer portions of the GNIRS acquisition keyhole, they should not be used for purposes of acquisition for spectroscopy.
| Mauna Kea Photometric Filters in GNIRS | |||||
| Filter Name | Wavelength range | Transmittance plot measured in GNIRSa |
Transmittance numerical data measured in GNIRSa |
Transmittance curve from manufacturer |
Gemini ID |
| Y | 0.97-1.07µm | yes | yes | - | G0544 |
| J-MK | 1.17-1.34µm | yes | yes | - | G0545 |
| K-MK | 2.03-2.37µm | yes | yes | - | G0546 |
ascaled to transmittance of the XD filter in the relevant wavelength interval
A zero point is defined as the magnitude of an object that would yield 1 ADU/sec at an airmass of 1. Zero points depend on instrument and telescope transmittances as well as detector electronics. They tend to be stable at the 3% level over many months. Measured values need to be corrected for variation of atmospheric extinction with airmass. The following table contains zero points for GNIRS with its short (0.15 arc sec/pix) camera and broad band "photometric" filters. Extinction values are taken from Tokunaga, Simons & Vacca (2002 PASP 114, 180) for 2mm of precipitable water vapor. See their Table 2 for extinction values for other amounts of precipitable water.
| Filter | Central wavelength (µm) |
Zero point magnitude (for 1 ADU/s) |
Typical extinction (mag/airmass) |
| Y | 1.02 | 24.069 +/- 0.085 | |
| J | 1.25 | 24.217 +/- 0.082 | 0.015 |
| H | 1.64 | 24.113 +/- 0.114 | 0.015 |
| K | 2.20 | 23.421 +/- 0.049 | 0.059 |
Guiding Options
GNIRS can be used with the standard Gemini peripheral wavefront sensors, or with the Altair adaptive optics module (in both natural and laser guide star modes).
Natural Seeing (Non-Adaptive Optics) Guided Observations:
GNIRS non-adaptive optics observations require the use of a peripheral wavefront sensor for both imaging and spectroscopy. The peripheral wavefront sensors (PWFS) operate in the optical. PWFS2 is preferred over PWFS1, as it can be used on fainter guide stars, can run at a higher frequency for a given guide star, works better under windy and cloudy conditions, and is smaller and thus vignettes less of the field of view.
Laser Guide Star (LGS) and Natural Guide Star (NGS) Adaptive Optics (AO) Guided Observations:
With Adaptive Optics: ALTAIR is used as the primary guider, providing adaptive optics correction for seeing effects. ALTAIR provides both Natural Guide Source (NGS) and Laser Guide Source (LGS) capabilities with GNIRS. ALTAIR can guide on fainter stars (to R~15 mag for A0 stars), but this will result in poor correction, and thus not recommended if brighter stars are available.
NGS: The guide star is used to provide wavefront information for the deformable mirror as well as overall image motion for tip/tilt. More information can be found here.
LGS: The laser created guide star provides information for the deformable mirror while a nearby star must be used for tip/tilt. This star can be much fainter than an NGS star used with the deformable mirror. Further details can be found here.
Guidelines for Selecting Guide Stars for Your GNIRS Observations:
Guidelines for selecting good guide stars are summarized in the table below. Note that the guide star brightness limits are for cloudless nights (50% CC) and optimal seeing (IQ ≤ 70%). ALTAIR can guide on fainter stars (to R~15 mag for A0 stars), but this will result in poor correction. We note that the automatic guide star selection in the Observing Tool (OT) will pick a guide star whenever possible that satisfies the telescope guiding constraints. Always check the guide stars "auto-selected" by the OT Position Editor, as the guide star catalogs have many spurious entries. Extended objects and binaries should be rejected.
| Guide Probe | Separation from the science target |
Guide star brightness (Vega magnitude) |
| ALTAIR (NGS) | < 25" |
R <~12 mag (optimal) R <~15 mag (faint limit) |
| ALTAIR (LGS) | < 25" |
R <~17.5 mag (bright time) R <~18.5 mag (dark time) |
| LGS+PWFS1 | 3.5' to 7' | R <~ 14 mag |
| PWFS2 | 3.5' to 6.5' (1) |
R <~ 15 mag |
(1) In XD mode, or if some vignetting of the slit and/or acquisition field of view can be tolerated, guide stars closer to the science target can be used (check for vignetting in the OT Position Editor and please add a note alerting the observer).
Sensitivity
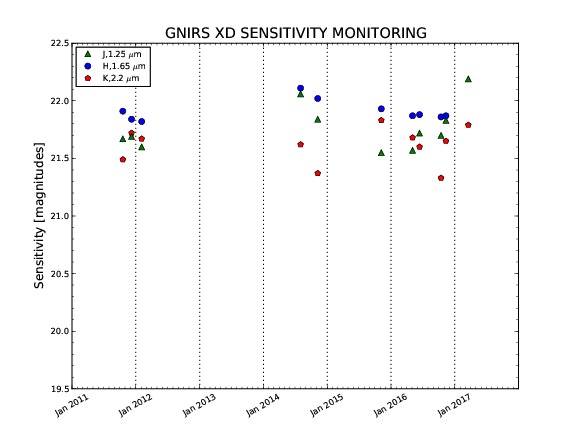
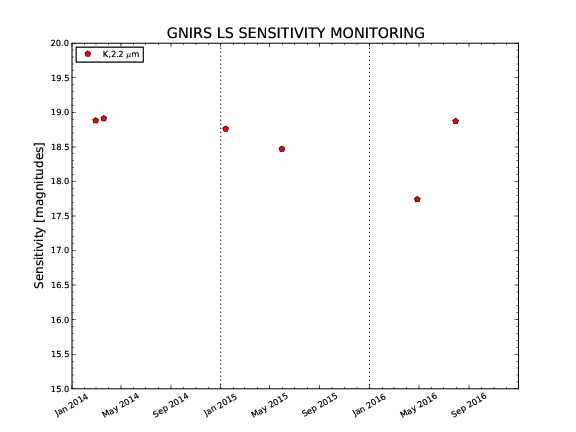
If you want to consult the monitoring of GNIRS sensitivity and throughput since 2011, please go here.
The following table provides estimated broadband magnitudes reached at 5 sigma (per spectral pixel) in 1 hour of integration, both without and with adaptive optics (AO). (This page gives information on sensitivity in imaging mode.) The values in the XJHK bands are at wavelengths that do not coincide with OH sky lines; at the wavelengths of OH lines the S/N will be lower, in many cases substantially so. The XJHK values assume twelve exposures of 300 seconds (5 minutes) each and ABBA nodding along the slit. (Longer exposures are possible and may result in improved sensitivity, but are not recommended at present, because the radioactive coatings in the current camera lenses create patches of bad pixels at a high rate. For the L and M bands it is assumed that the exposures are long enough that the noise is background-limited. The observing conditions assumed are 70%-ile image quality, 50%-ile cloud cover (clear), 80%-ile sky background (needed for X and J band observations only), 50%-ile water vapor and an airmass of 1.5.
The tabulated values are for a slit width (and thus resolution element) of 2 pixels and are for a single pixel on the spectral axis (thus, e.g., for a 2-pixel wide slit the sensitivity per resolution element is improved by sqrt(2) over the tabulated values). The values in the table and in the ITC also assume optimal summing of pixel values along the slit, with the number of pixels summed determined by the pixel scale and the image quality. Note that this is not optimal (i.e., weighted) extraction. The 5 sigma - 1 hour magnitudes are given at specific wavelengths near the center of each band which correspond to high atmospheric transmission and do not coincide with strong sky emission or absorption lines.
The values given are all for the long slit mode, i.e., with no prisms present. For observations in cross-dispersed mode, sensitivities are typically 0.1 magnitudes worse at X, J, and H, and 0.2 mag worse at K; there are modest reflection losses in the prisms as well as absorption losses at the red end of the K window.
AO correction is a strong function of wavelength. In the X and J bands the use of AO with incurs large slit losses. In the K band thermal emission from the warm AO system (which is roughly 90 percent transmissive) contributes significant thermal background, comparable to that of the telescope and the sky. Except in the K band at the highest resolving powers AO is not advised unless the science requires high angular resolution; higher sensitivity is achieved without AO. In the L band both the light losses and thermal emission are much higher, resulting in a much greater reduction in sensitivity than at shorter wavelengths. Indeed the high background prohibits use of AO in the latter band).
![]() Important caveats:
Important caveats:
- In the X, J, H, and K bands, S/N values for targets much brighter than the magnitude values in the table cannot be linearly scaled from the values in the table, because for much brighter sources, shot noise dominates, rather than read noise or background fluctuations, which determine the noise when the target is faint. E.g., the S/N on an H=8 mag star will not be 10,000 times higher in one hour than the S/N on an 18 mag star observed for the same amount of time.
- Values of S/N derived from this table that exceed several hundred are usually not realistic, not only because of the above shot-noise issues, but also because achieving very high S/N depends on many factors in addition to signal, background, and detector read noise.
- Within each IR band the sensitivity is a very strong, rapid, and non-monotonic function of wavelength, because of wavelength dependent atmospheric transmission and sky emission. Applicants should use the ITC to estimate the signal-to-noise ratio at the precise wavelengths of interest and/or over the entire band of interest.
- The AO sensitivities are derived from the expected performance rather than on-sky values. We believe that they are conservative. They may change during the next several months as we obtain more information about the performance of the instrument with AO.
| Adaptive Optics? |
Resolving power | Pixel scale | Slit width | Diffraction Order (and waveband or wavelength) | ||||||||
| 9 0.75um |
8 0.83um |
7 0.93um |
6 (X) 1.105um |
5 (J) 1.245um |
4 (H) 1.665um |
3 (K) 2.19um |
2 (L) 3.50um |
1 (M) 4.67um |
||||
| NO | ~1,700(a) | 0.15"(e) | 0.30" | 15.1 | 16.8 | 18.5 | 19.3 | 19.0 | 19.3 | 18.8 | 13.6 | - |
| NO | ~6,000(b) | 0.15"(e) | 0.30" | 13.8 | 15.5 | 17.3 | 18.6 | 18.5 | 18.5 | 18.2 | 13.1 | 10.5 |
| NO | ~18,000(b) | 0.05"(f) | 0.10" | - | - | - | 15.7 | 15.6 | 15.6 | 15.3 | 11.9 | 9.3(g) |
| YES | ~1,800(c) | 0.05"(f) | 0.10" | - | - | - | 15.3 | 15.8 | 17.5 | 17.9 | 9.7 | - |
| YES | ~5,000(a) | 0.05"(f) | 0.10" | - | - | - | 13.9 | 14.5 | 15.9 | 16.7 | 9.2 | - |
| YES | ~18,000(b) | 0.05"(f) | 0.10" | - | - | - | 13.0 | 13.8 | 15.0 | 15.6 | 8.0 | - |
(a) 32 l/mm grating
(b) 111 l/mm grating
(c) 10 l/mm grating
(e) short blue or short red camera
(f) long blue or long red camera
(g) R~13,000 (intrinsically lower than in other bands; see this table)
Performance Monitoring
Sensitivity
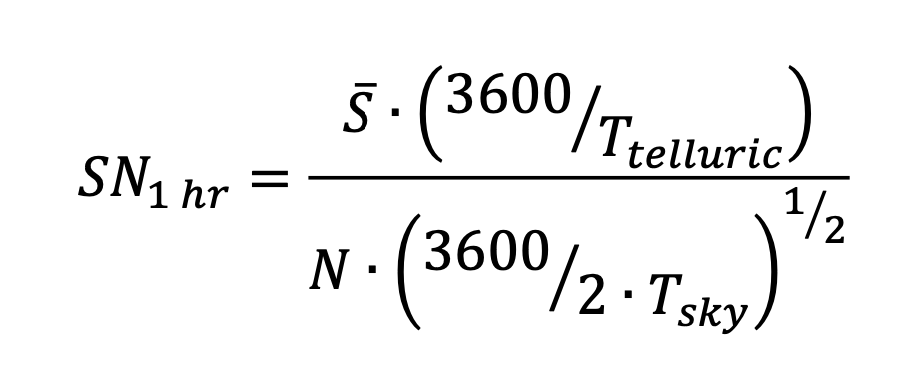
The sensitivities reported for GNIRS reflect the magnitude of an object that would provide a signal-to-noise ratio of 1 for an hour of integration time (SN1 hr). To calculate the signal-to-noise ratio, the signal is determined from spectrophotometric standard stars observed with requested photometric (CC50) IQ20 to IQ85 conditions, while the noise is determined from a subtracted pair of sky frames. The sky frames used have an integration time (T) > 150 seconds, observed within temporal proximity of the standard star, and are observed under the same photometric conditions. The sensitivity is calculated for two different modes: the cross-dispersed (XD) mode observed using the short blue camera and the 32 l/mm grating, and the long-slit (LS) mode observed using the long blue camera and the 111 l/mm grating.
The signal is found by taking the mean over the standard star's spectrum (S) with an aperture equal to 1.18*FWHM. With a subtracted pair of sky frames, on an area of sky generally free of sky lines and artifacts, noise (N) is determined by multiplying the average standard deviation in the background counts by the square root of the aperture area used to find the signal.
With a subtracted pair of long-sky frames, on an area of sky generally free of sky lines and artifacts, noise (N) is determined by multiplying the average standard deviation in the background counts by the square root of the aperture area used to find the signal.
 |
To find the sensitivity, the signal-to-noise ratio (SN1 hr) is converted to a magnitude and added to the Simbad magnitude (MSimbad), in the corresponding waveband, of the standard star:
 |
Sensitivity measurements for standard star observations, taken at the central wavelength of each band, are reported below.
Throughput
XD20170319 observed using the long blue camera and the 111 l/mm grating. All throughput measurements are based on observations of spectrophotometric standards, collected under photometric conditions. Throughputs are defined as follows:
 |
where: Nd(λ) is the number of photons detected with wavelength λ and Nt(λ) is the number of photons of the same wavelength hitting the telescope's primary mirror. The latter is given by:
 |
where N*(λ) is the star's photon flux at wavelength λ above Earth's atmosphere, in number of photons/cm2/s, μ is the airmass, and Aλ is a mean monochromatic extinction coefficient.
The numbers available below are average values, that do not account for throughput variations as a function of grating angle.
| Mode | Latest Measurement | History |
| XD | 20170319 | click |
| LS | 20161111 | click |
