Summary
Gemini Observatory tracks how telescope time is used each night at each site, and also monitors the completion rates for observing programs. The telescope time use and program completion statistics are updated and reported to oversight committees twice a year. Ad-hoc reports have also been generated in response to specific requests from committees or from internal analysis of operations. The following summarizes the current status of these Science Operations Statistics.
Demand for Gemini Telescope Time
Typically the Observatory executes about 65% of the advertised science time in the Call for Proposals, the remaining time going primarily to weather loss. Currently, the available time advertised in the Call for Proposals is filled to the 80% level with classical and queue bands 1, 2 and 3 programs, to avoid overfilling the queue and disappointing band 3 investigators. Bands 1 and 2 are each filled to 30% of the advertised telescope time, and Band 3 to 20%. Poor weather programs in band 4 are designed to use any remaining very poor but useable telescope time.
The figures below show the average (weighted by participating country (Participant) share) over-subscription of the Gemini telescopes between semesters 2015A and 2021B (Figure 1), and the over-subscription by participant for Gemini North (Figure 2) and South (Figure 3). The over-subscription shown on the left axis is calculated as 80% of the ratio of the total Gemini time requested to the total advertised available science time. The available Gemini science time includes all three science bands 1, 2 and 3, and the requested time does not include program calibrations. Telescope time used in program calibration varies by instrument and instrument mode, and ranges from 5% to 25%.
![[All Submission]](/files/Over-Subscription%20for%2080%25%20Filling%2C%20Participant%20Share-Weighted%20.png)
Figure 1: Historical over-subscription rate, weighted by participant share, since semester 2015A for the 80% queue filling factor.
![[North Partner Submission]](/files/Historical%20Gemini%20North%20Over-Subscription%20by%20Participant%20(80%25%20Filling).png)
Figure 2: Gemini North historical over-subscription rate by participant for the 80% queue filling factor.
![[South Partner Submission]](/files/Historical%20Gemini%20South%20Over-Subscription%20by%20Participant%20(80%25%20Filling).png)
Figure 3: Gemini South historical over-subscription rate by participant for the 80% queue filling factor.
Although the average over-subscription for the Gemini telescope is around a factor 2.5, the demand for certain parts of the sky, and for certain observing conditions, can be much higher. The chart shown in Figure 4 illustrates this by using the 2021B semester demand from the US community. Certain RAs, in good seeing, can be oversubscribed by factors greater than 10. Also, good-seeing (IQ70 or better, seeing <0.8 arcsec), photometric dark time is oversubscribed by a factor of >5, while poorer seeing (IQ85, seeing 0.8 to 1.2 arcsec) is oversubscribed by a factor of about 2.
.jpg)
Figure 4: The 2021B demand from the US community as a function of RA and observing conditions. The condition bins are described in the legend to the right. Regions of heavier demand are highlighted.
Weather loss and delivered science nights
Each semester at the time of the Call for Proposals, the Observatory with input from the Operations Working Group decides on the number of offered science nights. The science queue (and classical nights) are filled using this number of science nights. The actual delivered number of science nights can either be larger (if planned engineering or commissioning tasks did not happen) or smaller (if engineering or commissioning tasks take longer than planned or if unforeseen events happen). In addition, the weather loss for a given semester will affect the completion rates. Figure 5 below shows the use of available time at each site for semesters 2005A to 2024A. The COVID-19 pandemic in 2020 - 2021 and the cyber incident in 2023 severely impacted both sites. The mirror incident affected Gemini North in 2022-2023.
![[North Time Use]](/files/GNtimeuse24A.png)
Figure 5: Gemini North time use - science, engineering, faults and weather distribution.
![[South Time Use]](/files/GStimeuse24A.png)
Figure 6: Gemini South time use - science, engineering, faults and weather distribution.
Completion rates for queue programs
The completion rates of queue programs are closely tracked and queue planning is carried out to optimize the completion rates. Full multi-instrument queue planning was put in place at Gemini North starting in semester 2005A, with Gemini South following in semester 2005B.
Figure 7 shows the queue completion rates for both sites from semester 2019B to 2024A.
![[completion-rates]](/files/Completion_80_24A.png)
Figure 7: The fraction of programs with 80% or more of their allocated time used, for each site, per semester. The large amount of time lost due to the COVID-19 pandemic impacted 2020A programs at Gemini South especially while the mirror incident affected completion rates at Gemini North in 22B-23A.
Completion expectations for queue programs
Here we give a guide to expectations for the completion of Band 1, 2 and 3 programs. The three bands are best described as (i) top priority, intended to be executed and if possible completed (ii) lower priority, but intended to be executed to some reasonable completion rate and (iii) fillers, which should, in order to get data, be able to take worse observing conditions and be particularly aware of other constraints that may affect their execution.
We fill the queue to a level consistent with the above descriptions in a semester with reasonable weather. In case of a semester with poorer-than-normal conditions or significant instrumental or telescope problems, we attempt to protect programs in Band 1 as best we can (in the sense that any good weather will go to those programs). It is a clear signature of bad weather that Band 3 completions exceed those in the other two bands, and in such cases, programs in Band 2, which still tend to have tight observing conditions requirements, often lose out. The above analysis excludes target of opportunity programs, for which the completion rate depends on the rate of triggers and which we cannot therefore control, and block-scheduled instruments or observing modes, where statistics vary a lot (up and down) due to coincidences between observing blocks and weather.
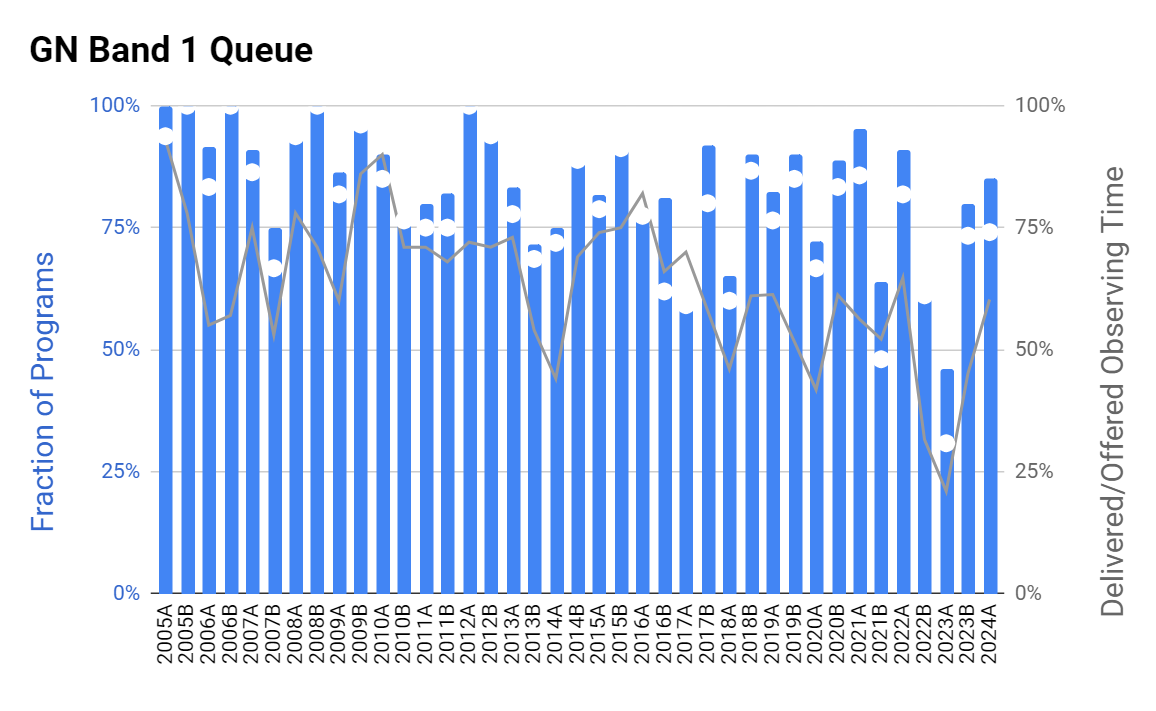
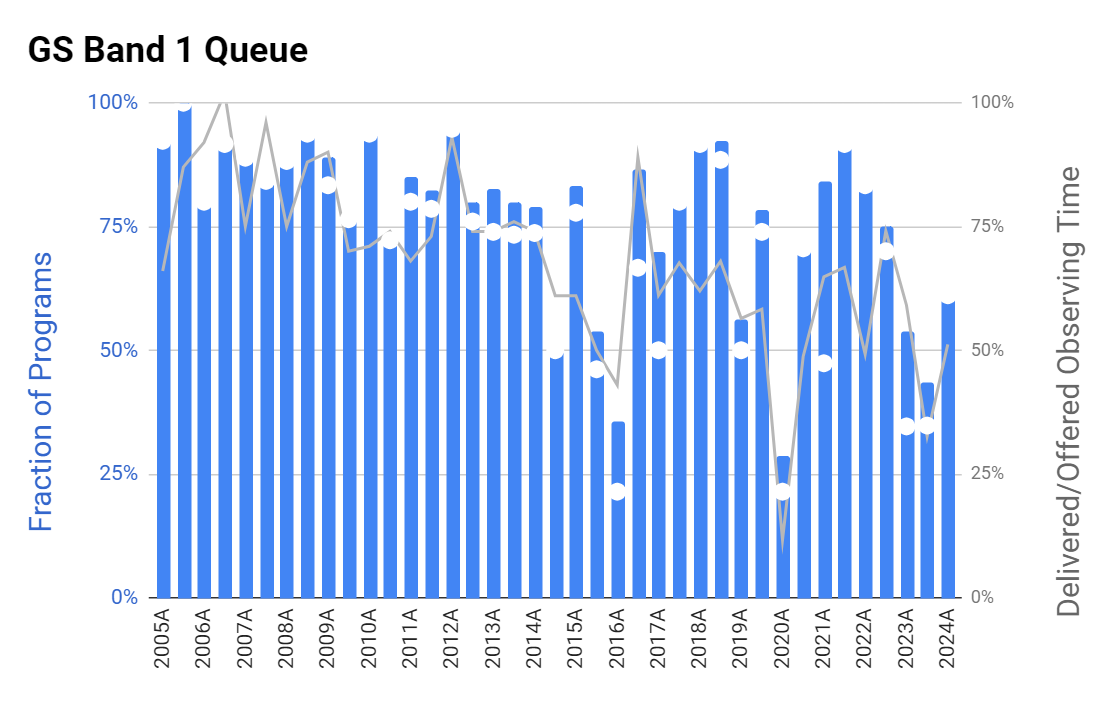
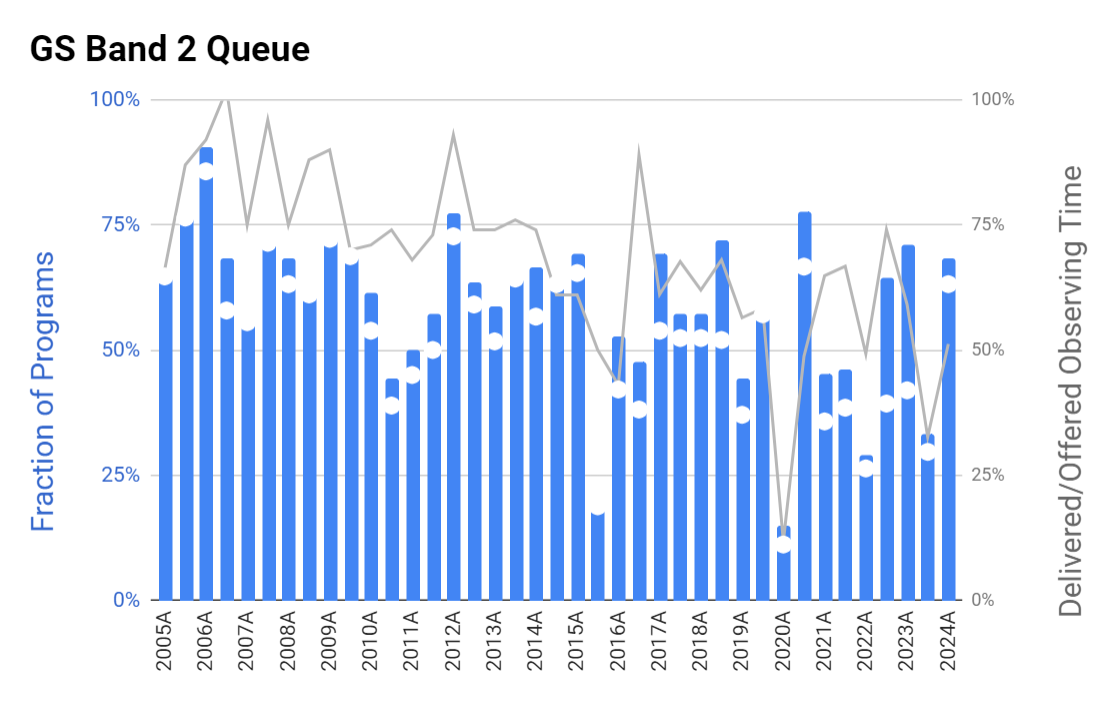
The figures below show completion statistics in the regular queue, over the period since the commencement of multi-instrument queue observing in 2005. Grey lines represent the ratio of the total usable time in the semester to the total advertised time in the call for proposals (this line has a mean level corresponding to weather loss). The blue histograms represent the fraction of programs achieving a completion rate of 80% or above, and the white dots show the corresponding fraction of programs which achieved a completion rate of 100%. These figures should serve as a guide to what to expect in terms of completion rate. They exclude Target of Opportunity programs, and those executed in "schedule blocks".
Gemini North
The M1 incident of October 2022 and subsequent extended downtime resulted in suppressed completion rates in all three bands at Gemini North; however Band 1 approached 50% with the help of redistribution of programs to Gemini South.
- Grey: Ratio of total usable time in the semester to the total advertised time
- Blue: Fraction of queue programs reaching 80% complete
- White dots: Fraction of queue programs reaching 100% complete
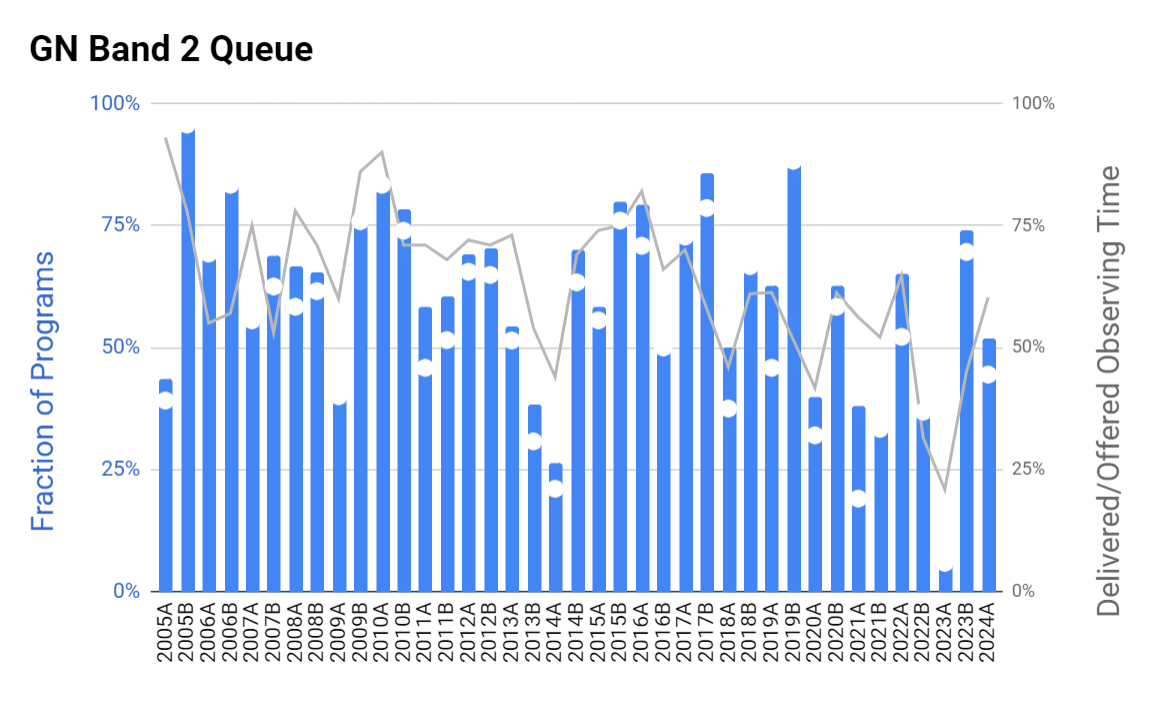
- Same as figure above.
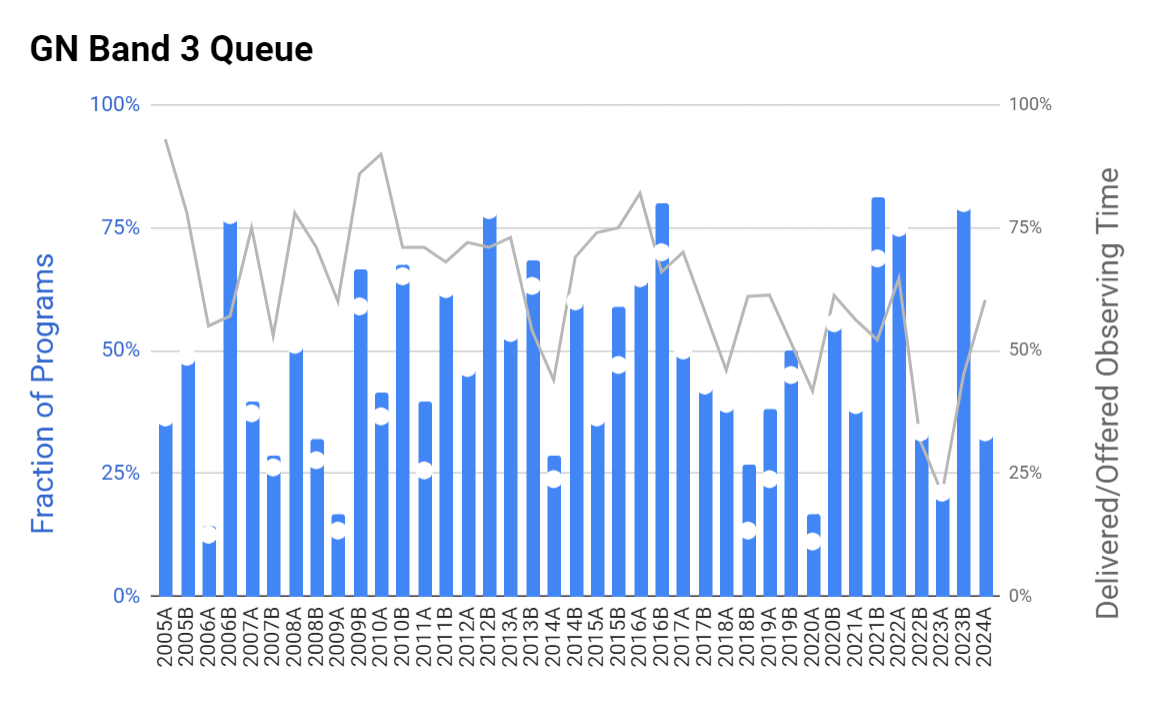
- Same as figure above.
Gemini South
The most pronounced feature of Gemini South completion rates is the major shortfall in 2020A, for a large fraction of which the telescope was closed by the COVID pandemic.
- Same as figure above.
- Same as figure above.
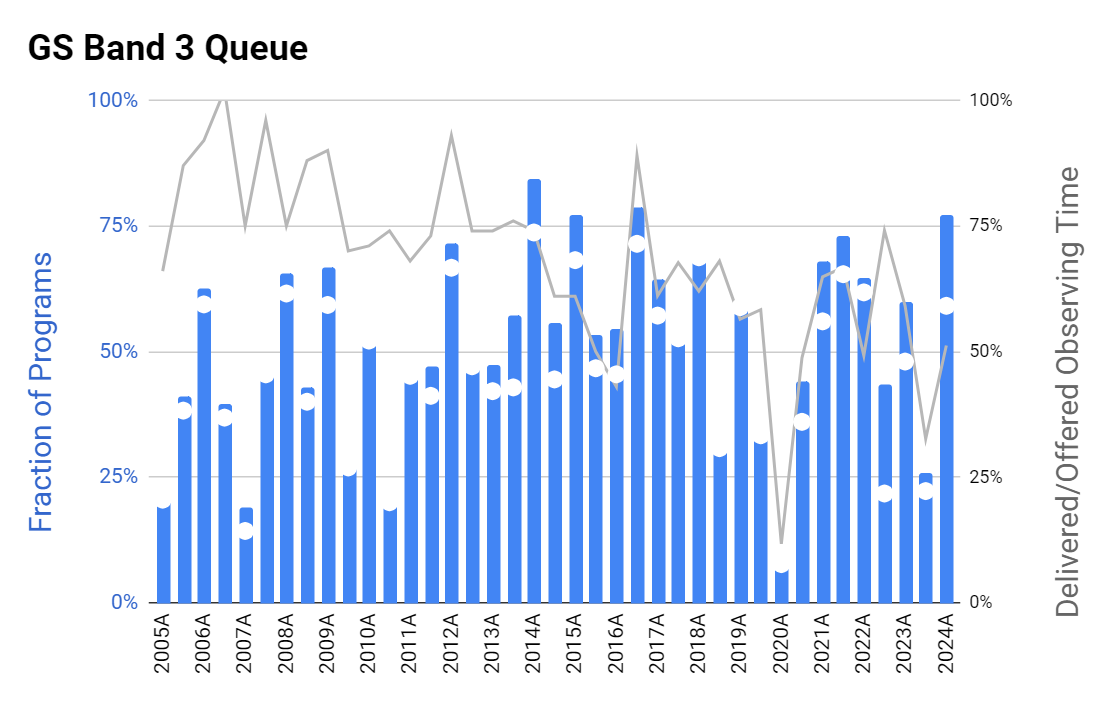
- Same as figure above.
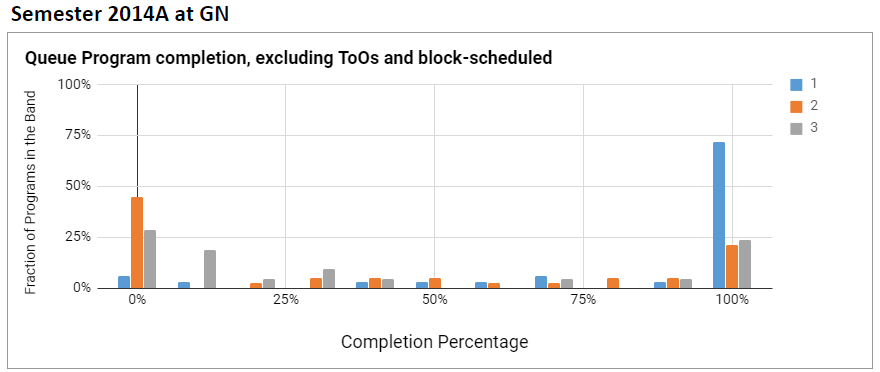
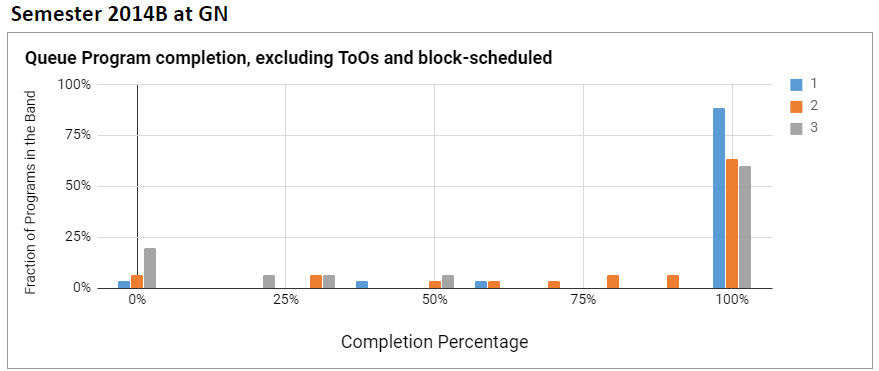
Breakdown: good and bad semesters
As seen above, Gemini North in 2014A presented a particularly bad semester, with shutter failure and weather reducing the amount of available time significantly. 2014B represented a more "average" semester, with good Band 1 completion rate and an understandable distribution between Band 1,2 and 3. Note that in a "reasonable" semester, a good fraction of programs reach 100% completeness.
Efficiency of Gemini Observations
When submitting a proposal for Gemini telescope time, all overheads associated with science observations must be included, except for those associated with the default set of baseline calibrations (described for the GMOS instrument here, and for the infrared instruments here). The overheads vary with instrument and instrument mode. Each instrument page lists specific overheads associated with the instrument, including target acquisition, instrument configuration, detector readout, and telescope offsetting. When submitting a proposal for telescope time, these overheads must be included, and can most easily be determined using the integration time calculator (ITC) for the instrument. The Observing Tool (OT), with a fully populated phase ii observation, will also calculate the appropriate detector, hardware and telescope overheads.
Starting in 2017B the Phase I Tool (PIT) automatically adds the time required for baseline calibrations to the observation request. This time needs to be included in the total time request, but it is charged to the relevant Gemini participant. However, any calibration beyond this basic set (GMOS instrument calibrations, infrared calibrations) does need to be included explicitly in the proposal and that time will be charged against the program. The time charged is the actual time used and not the time estimated.
The open shutter efficiency for Gemini instruments has been determined for each semester between 2008 and 2018. Open shutter efficiency is defined as the sum of all science and calibration exposures obtained between evening and morning twilight, divided by the usable time available (hours between twilight less time lost to weather or technical faults). The shutter efficiency is approximately the same for both Gemini North and South, and is typically around 60%. The remaining time is spent on telescope slews between targets, target acquisitions, telescope offsets (dithers) on target, instrument hardware configuration changes, and detector readtime.