Announcements
Baseline Calibrations
All calibrations, including tellurics, flatfields and arcs, must be specified in the Phase II definition. These "baseline" calibrations are summarized in the context of all Gemini Near-IR instrument calibrations (i.e. 1-5 µm imaging and spectroscopy).
Calibrations for GNIRS depends on the mode in which the instrument is configured, and can be summarized as follows:
- Long Slit (LS) mode: This is the simplest mode for GNIRS. The baseline calibrations consist of the Standard Telluric, which should be defined before and after the science observations, the spectroscopic flats and the arcs.
- Integral Field Unit mode: While more complex than long slit mode, the baseline calibrations are the same as those in the long slit mode.
- Cross-Disperser (XD) mode: For this configuration of GNIRS, the baseline calibrations are the same as in LS mode, in addition to the pinhole calibrations, which are used to trace the spectrum through the different orders within the camera. The pinhole observations are taken on day-time just after observing the sciece program
Flat-fielding and arc lamp wavelength calibrations for GNIRS are obtained with the facility calibration unit, GCAL. The spectroscopic flats and the arcs are taken on-sky near-simultaneously with science observations, this meas that the sequence for science also contains these calibration data. Pinhole calibrations are carried out during morning or evening twilight or in daytime.
Further information on near-IR calibration, including line lists, standard star search tools and spectral template libraries, can be found on the NIR resources pages.
Flat Field Info
The baseline default GNIRS flat fields that are obtained near-simultaneously with the science spectra are designed to provide higher signal-to-noise ratio (SNR) flat fields than the SNRs of typical science spectra, in modest amounts of time (a few minutes at most). They consist of a small number of individual flat field frames, which are summed by the user.
For long slit, single order spectra the final (summed) flat fields have SNRs of 200-400, where the range in values roughly accounts for wavelength-dependent filter transmission and grating efficiency. For IFU mode, the SNR is roughly similar to the those of the equivalent long slit observation (i.e., the 0.3"-wide slit and 0.1"-wide slit for the LR- and HR-IFUs, respectively).
In cross-dispersed mode the rms SNRs of the summed flat fields are as follows.
- K (order 3): 200-400
- H (order 4): 300-600
- J (order 5): 300-600
- X (order 6): 200-400
- 0.95µm (order 7): 150-300
- 0.85µm (order 8): 70-140
- orders 9-11: 20 or less
Users who require higher SNR flats than those described above should make their needs known to their NGOs, who can query the Gemini staff contact scientist if necessary.
Arc Lamp Identifications
The following table shows a summary of GCAL emission line plots for two lamps (Ar and Xe) at near IR wavelengths. The spectra all have the same integration time. Wavelengths are in vacuum. See also the general wavelength calibration page for more line lists etc.
In general, the Argon lamp will be sufficient for wavelength calibration in most GNIRS observing modes. However, for the long camera / 111 grating case (R=18,000 mode), you may need to take supplementary Xenon lamp observations at wavelengths where the Argon lines are sparse. Check the plots below to verify this.
Note: The wavelength range in each of the plots below is equivalent to the coverage delivered by the short camera / 111 grating mode (R=6000), and 3 times the spectral window of the long/111 mode. The Argon lamp is sufficient for all arc lamp calibrations when using the 32 l/mm grating.
| Waveband | Wavelength Range (microns) | GCAL Arc Lamp Plots | |
| J | 1.046 - 1.143 | Argon | Xenon |
| J | 1.142 - 1.246 | Argon | Xenon |
| J | 1.242 - 1.379 | Argon | Xenon |
| H | 1.471 - 1.598 | Argon | Xenon |
| H | 1.592 - 1.728 | Argon | Xenon |
| H | 1.723 - 1.813 | Argon | Xenon |
| K | 1.962 - 2.078 | Argon | Xenon |
| K | 2.070 - 2.242 | Argon | Xenon |
| K | 2.233 - 2.399 | Argon | Xenon |
The following image and plots contain spectra of the argon lamp and line identifications: first a spectral image with some line IDs for the complete cross-dispersed 32l/mm grating + short camera mode, and then separate plots for orders 3 through 8 of that mode .
| Order | Approx. Wavelength Range (microns) | GCCAL Argon Lamp Image/Plots |
| 3-8 | 0.8 - 2.5 | jpg image |
| 3 | 1.88 - 2.52 | jpg image |
| 4 | 1.41 - 1.90 | jpg image |
| 5 | 1.13 - 1.51 | jpg image |
| 6 | 0.95 - 1.25 | jpg image |
| 7 | 0.90 - 1.06 | jpg image |
| 8 | 0.72 - 0.95 (signal very weak < 0.9) | jpg image |
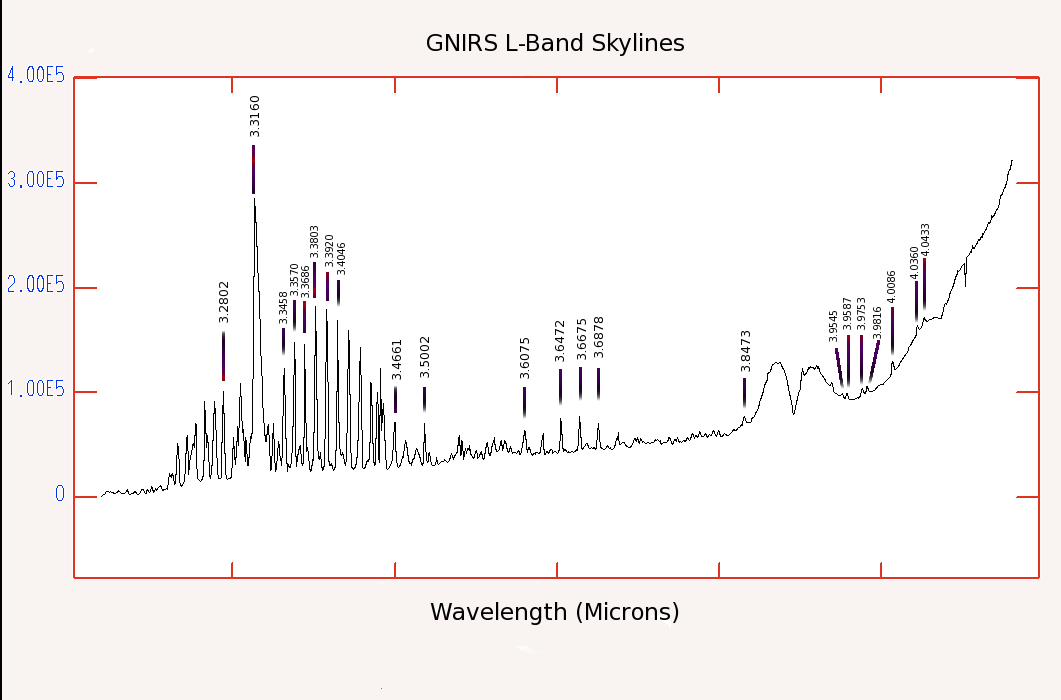
The following plot showing wavelengths of sky emission lines at 3-4 microns may be useful for wavelength calibration of GNIRS L band data. The data were taken using the 0.15"/pixel camera, 32 l/mm grating and 0.3" slit, for R~1800.
L band sky emission lines

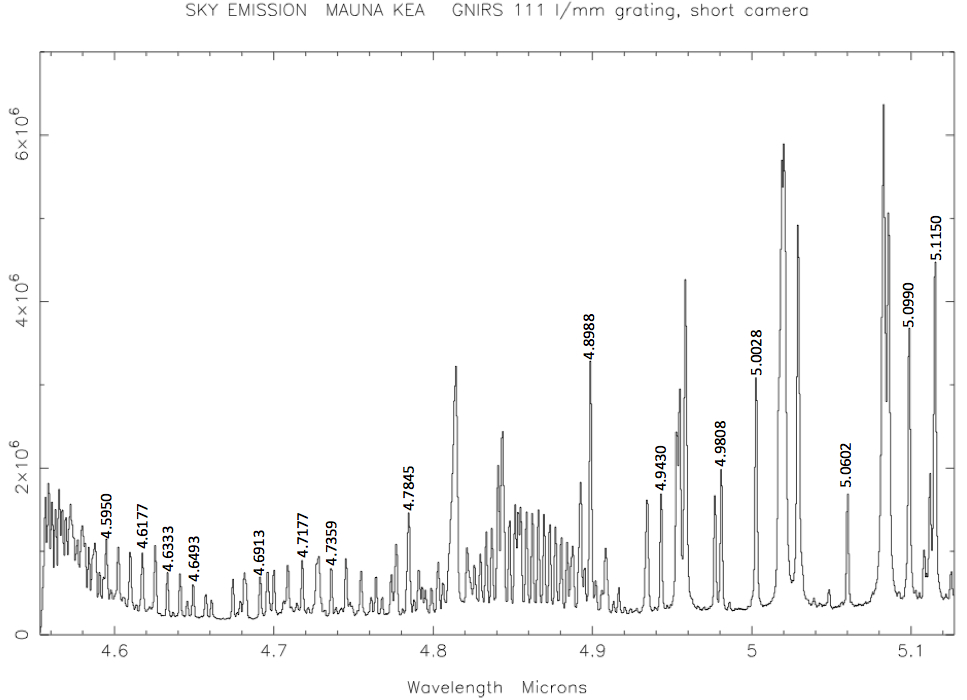
The following plot showing wavelengths of sky emission lines at 4.55-5.12 microns may be useful for wavelength calibration of GNIRS M band data. The data were taken using the 0.15"/pixel camera, 111 l/mm grating and 0.3" slit, and have R~4300.
M band sky lines
