Announcements
Imaging
FLAMINGOS-2 covers a circular 6.1 arcmin field with an average plate scale of about 0.179 arcsec / pixel. We present here:
- the Image quality
- the Field distortions
Image quality
The specifications for the FLAMINGOS-2 image quality are 50% encircled energy (EE) within 25 μm diameter, and 80% EE within 43 μm at the detector (18 μm / pixel). Using images of a pinhole grid mask, we obtained a full-width-half-maximum (FWHM) of 0.36 arcsec across the 6 arcmin field-of-view, meeting the specifications.
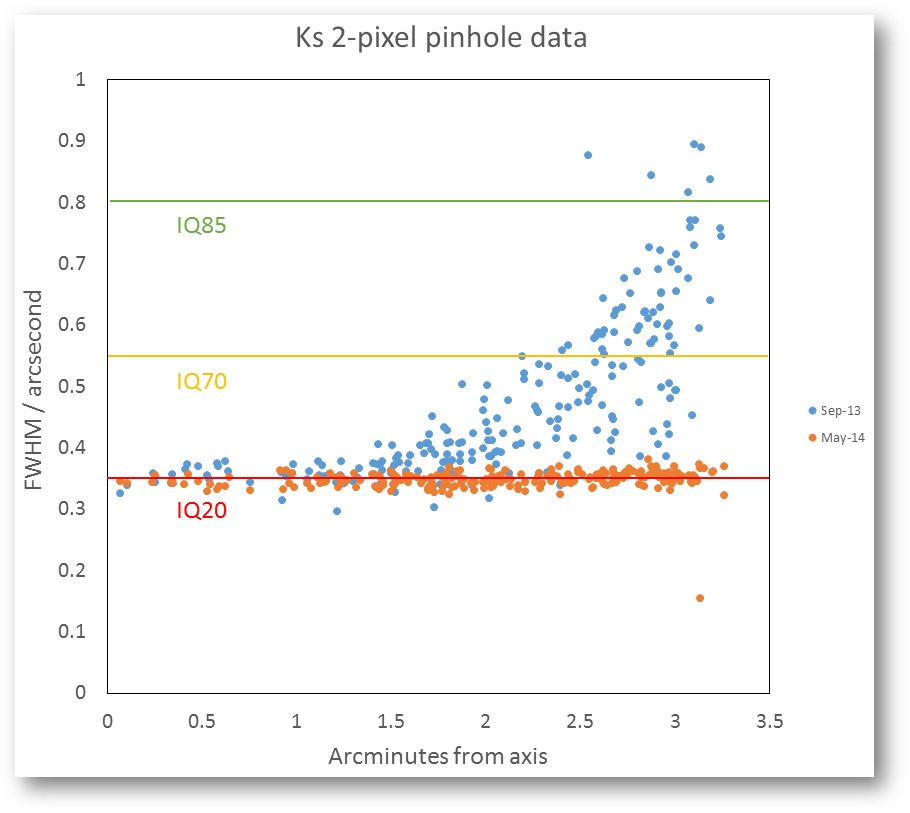
Fig.: FLAMINGOS-2 measured FWHM, as a function of distance from center. Due to an optical misalignment, FLAMINGOS-2 showed increasing PSF values in 2013, and was brought back to specifications after an intervention in 2014. Horizontal lines mark the FWHM values in various observing condition constraint bins (Image Quality 20%-ile = IQ20, etc.).
Field distortions
The plate scale of FLAMINGOS-2 ranges from 0.1792 arcsec / pixel on-axis to 0.1787 arcec / pixel at the outermost radius. Even though modest, these distortions must be taken into account when coadding sets of dithered images to avoid image degradation.

Fig.: Optical distortions (plate scale variations) for FLAMINGOS-2, determined with Scamp from 85 dithered Ks-band observations of a dense stellar field. Note that the corners are extrapolated, because they do not contain data due to the circular field-of-view. The small spatial offset of the distortion pattern from the center of the square detector array is real.
Spectroscopy
Two types of spectroscopy are possible with FLAMINGOS-2 and its selection of gratings:
- Long-slit spectroscopy with slit widths of 1, 2, 3, 4, 6 and 8 pixels. They have length ~4.4' (263", 1460 pixels) in the standard f/16 (non-AO) mode.
- Multi-object spectroscopy with custom cut MOS masks, covering a 2.0x5.8 arcmin field of view.
Spectroscopy with FLAMINGOS-2 always requires a filter / grism combination to select a wavelength range of interest, see also the filter page.
- Two lower resolution grisms (JH and HK) with peak R~1300 and simultaneously covering the J&H or H&K bands.
- One higher resolution grism with peak R~3200 (for the two pixel wide slit) giving complete coverage of one (Y or J or H or Ks or K-long) near-IR band at a time.
- The achieved resolution averages are R~1000 within 70% of the JH and HK ranges, and R~2900 within the ranges J, H or Ks/K-long. Consult the grisms page to obtain more information about how the spectral resolution changes with wavelegth. The resolution is constant across the slit length.
Long-slit spectroscopy
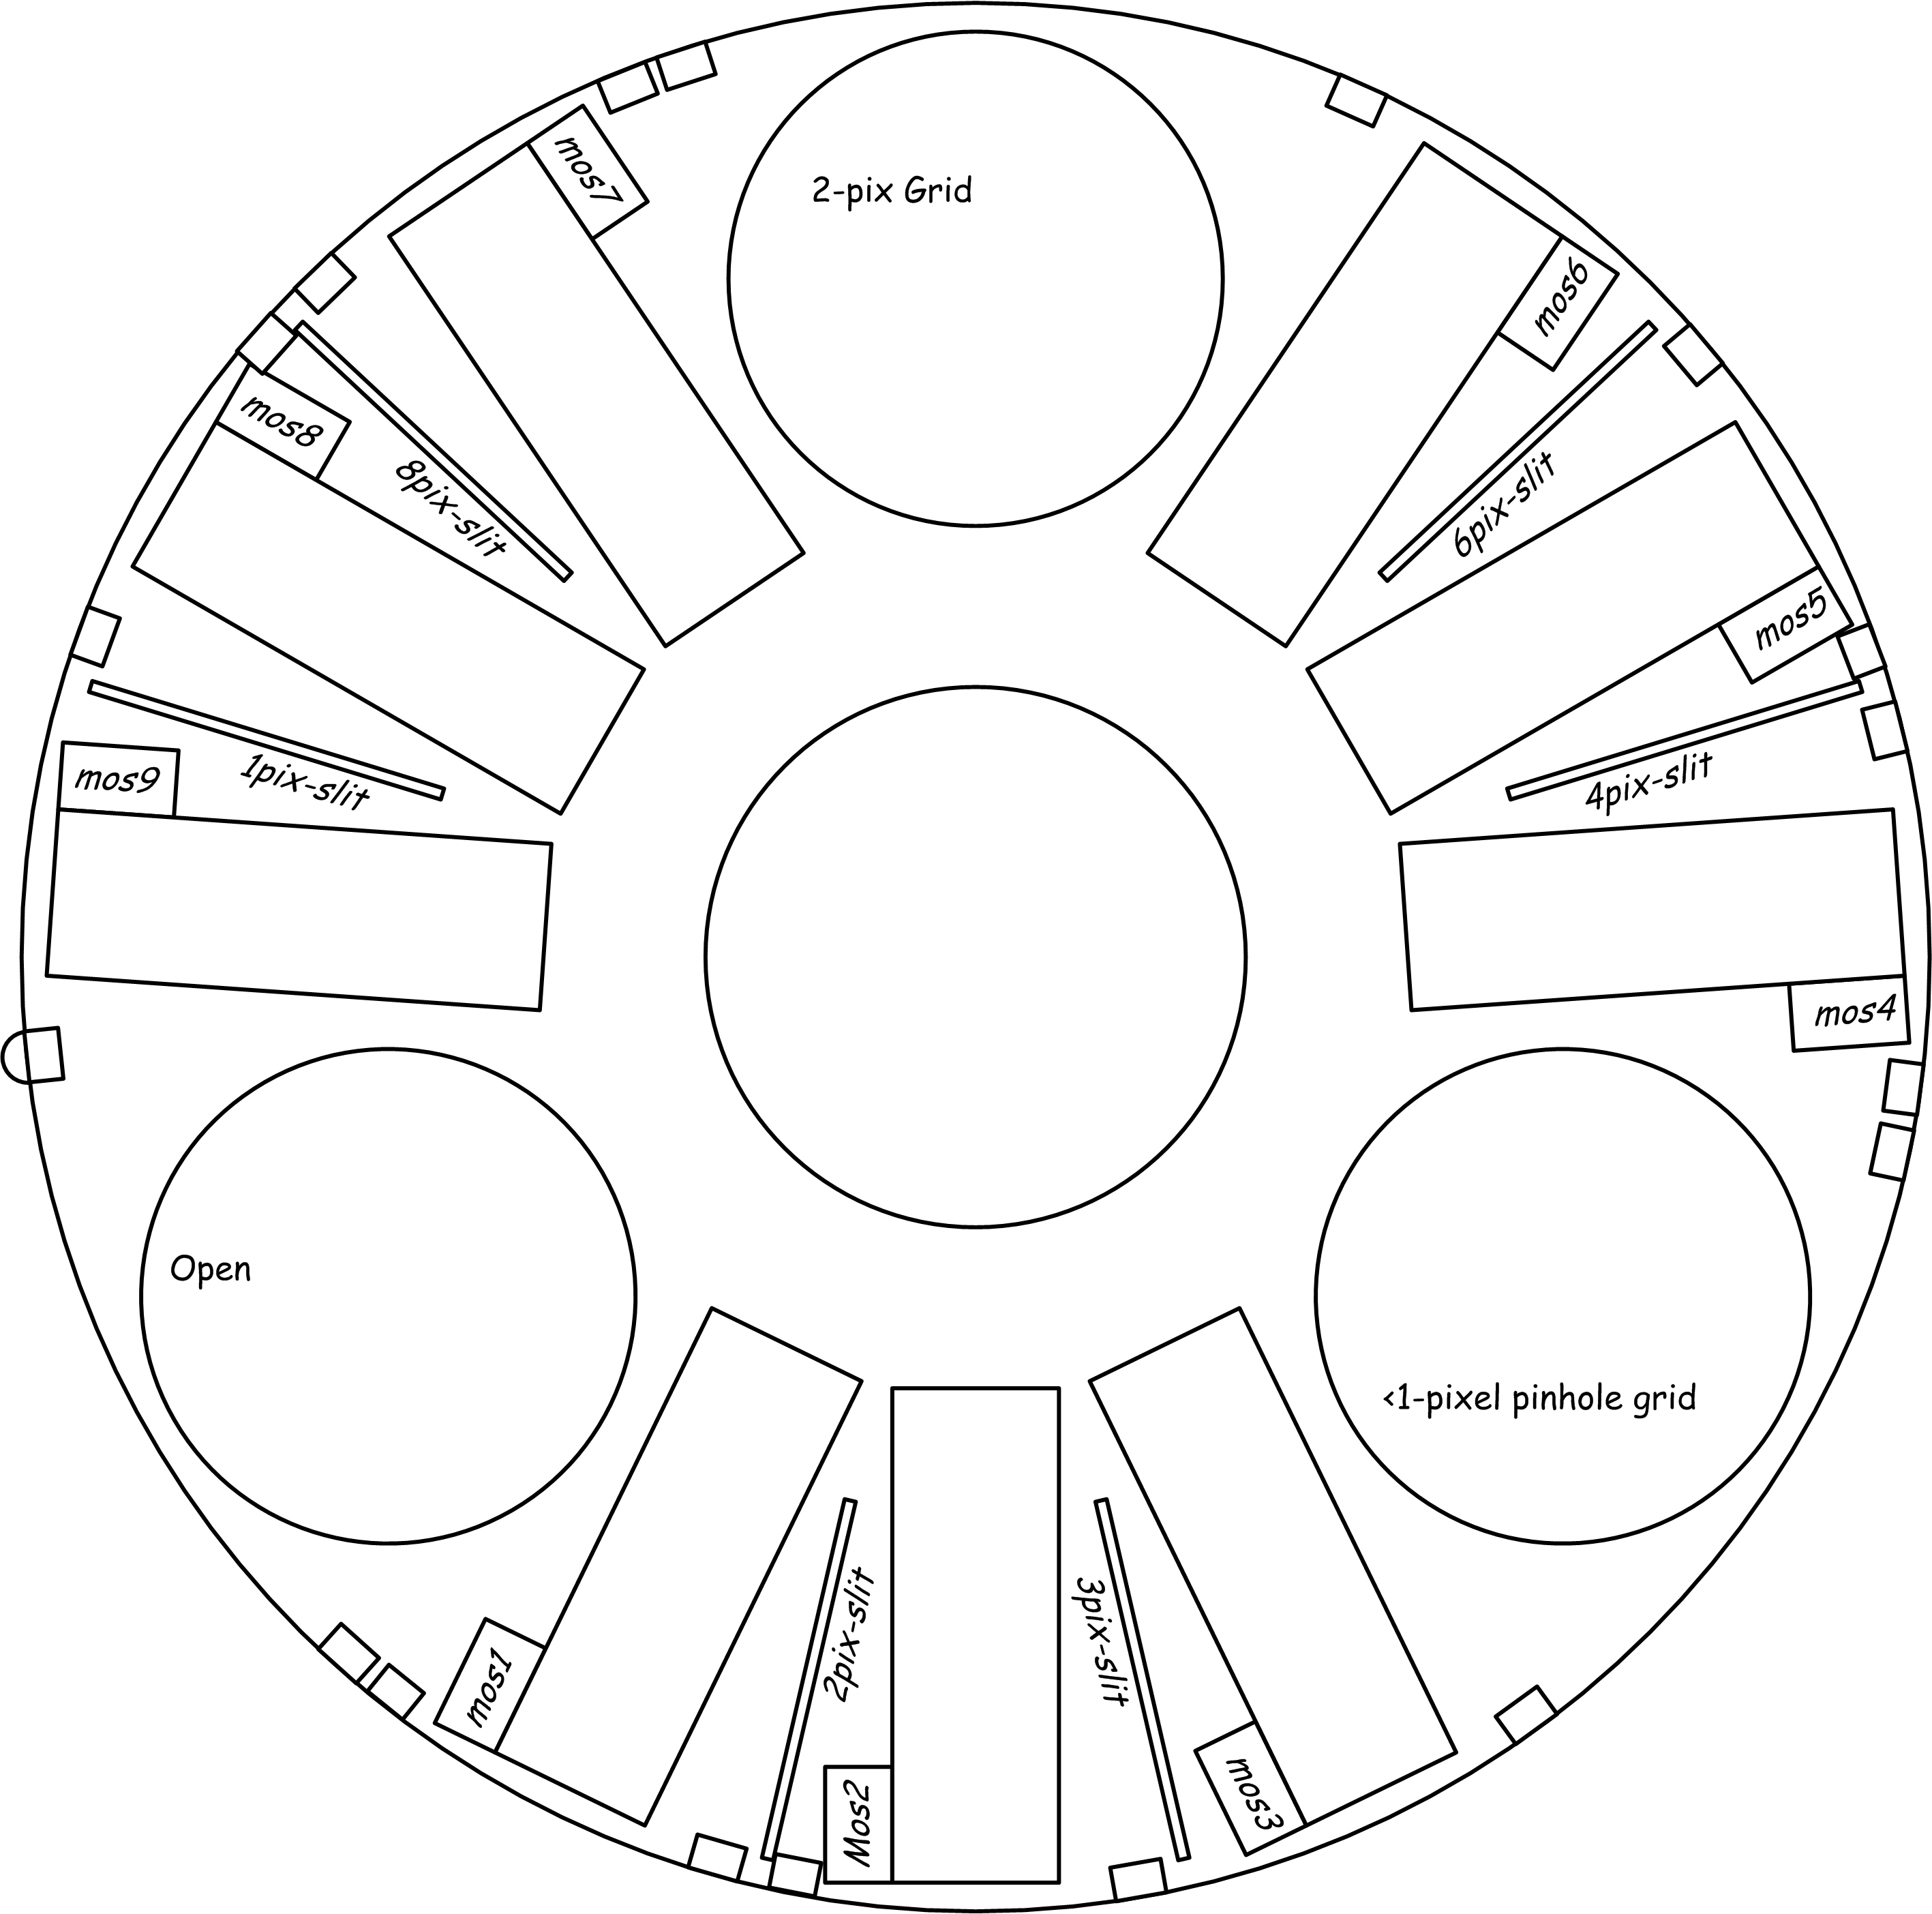
FLAMINGOS-2 has a number of permanent long slits available for long-slit spectroscopy (see the MOS wheel schematic for the locations of these long slits within the wheel). The widths of the long slits are 1, 2, 3, 4, 6, and 8 pixels. They are all ~4.4' (263", 1460 pixels) in length. These long slits can be used with either the moderate or higher resolution grisms. The f/16 and f/32 pixel scales in spectroscopy mode are the same as those in imaging mode.
The available slits are shown in the following table. The slit widths are given in pixels and arcsec projected on the sky. The spectral resolution is lower in a wider slit (see the grism table), even for point sources since under most atmospheric conditions the seeing wings of pointlike objects fill the wider slits. Note that the average spectral resolution is significantly lower than the peak resolution achieved at the center of each spectral range.
|
Slit width |
Slit width |
JH/HK Grisms ~Peak R (Δλ/λ) |
JH/HK Grisms ~Average R (Δλ/λ) |
R3k Grism ~Peak R (Δλ/λ) |
R3k Grism ~Average (Δλ/λ) |
|
1 |
0.18 |
1700 |
1300 |
4500 |
3600 |
|
2 |
0.36 |
1200 |
900 |
3200 |
2800 |
|
3 |
0.54 |
900 |
600 |
2200 |
1600 |
|
4 |
0.72 |
600 |
350 |
1600 |
1300 |
|
6 |
1.08 |
400 |
130 |
1100 |
1000 |
|
8 |
1.44 |
300 |
100 |
800 |
750 |
Offset strategies for long slit spectrsocopy
The standard strategy for point like or compact objects involves the use of ABBA offsets along the slit, represented in the Observing Tool sequences as "Q" offsets with amplitudes of 10 to 60 arcseconds depending on the requested conditions and target angular size. In the Observing Tool the use of the Flamingos-2 Iterator or the Repeat iterator before the ABBA offsets, allows to keep the sequence after each iteration (e.g. ABBAABBAABBA).
However, different approaches are possible: Flamingos-2 does not provide frame coadds, therefore when observing bright objects the exposures can be repeated a few times in each offset node, in order to save overhead time (i.e. AAAABBBBAAAABBBB). After a couple of minutes of short spectral exposures in the same node, the telescope is then moved to next node. Other strategies involve using ABABABABAB offsets because the sky contribution is modeled and uniform time sampling is needed at each node.
Any offset strategy must take into account that the sky emission lines can vary significatively in scales of 2 to 5 minutes.
Multi-Object spectroscopy
| Mask Field of Regard | 6’ x 2’ | Targets from F2 pre-image or catalog. |
| Max. # of 4.5” length slits | 72 | Nodding along the slits (100% on source). |
| Max. # of 1.8” length slits | 153 | Offsetting to sky position (50% on source). |
| Spectral coverage | 0.97—2.48 μm | YJH, HK, J, H, K-long band modes. |
| Spectral resolution (R) | 700 to 2000 | Single / Broad band, 0.54” slit. |
| Best spatial image quality | 0.4” | H band, IQ 20%-ile observing conditions. |
The multi-object spectroscopy (MOS) mode allows the simultaneous observation of up to 150 targets per mask over an area of 6’x2’, with a maximum of 9 masks installed on the instrument per thermal cycle. The sensitivity, observing efficiency and spectral ranges are the same as for the long-slit modes.
We recommend to use the on-instrument wave front sensor (OIWFS) because it minimizes the spectral losses due to flexure between the focal plane unit and the telescope guiding system, allowing a minimum slit width of 0.54” (spectral resolution ~2000) for zenithal distances up to 60 degrees. In addition, the aligment of the mask is slightly better achieved with the OIWFS, which also produces a small or neglible vignetting on the mask field compared to the PWFS2.
| Mode |
Spectral Range |
Average Spectral Resolution |
Limiting Mag. (S/N=5, 1hour) |
|---|---|---|---|
| YJH | 0.97—1.80 | 700 | 20.9 (J) |
| HK | 1.26—2.50 | 700 | 20.3 (H) |
| J | 1.17—1.33 | 2000 | 18.9 (J) |
| H | 1.48—1.78 | 2000 | 19.7 (H) |
| K-.long | 1.90—2.48 | 2000 | 18.9 (K) |
F2MOS masks are designed using gmmps (see in particular the F2 MOS example). Even though gmmps allows input coordinates from both pre-images and pseudo-images generated from catalogs, currently, for the narrowest slits (0.54'' and 0.72'') the use of pre-images will be mandatory, in order to avoid problems asocciated to poor world coordinate system in the referential pseudo-images, catalog errors or wrong proper motion data. Pseudo images may be used for 1.08'' and 1.44''-wide slits.
The mask aligment tests show that any set of at least 3 reference stars detected with a S/N &sim: 10 will be suitable to provide an aligment rms of the order of 0.1", in the limit of the OIWFS (and PWFS2) mechanical repeatibility. It is also recommended that the aligment stars should not be so bright as they can saturate the detector in the case of changing of the observing conditions (for instance, from IQ70/CC70 to IQ20/CC50). The following table summarizes the required brightness ranges for the aligment stars
| Acquisition Band |
Magnitude range (5sec exposure time) |
Magnitude range (15sec exposure time) |
Magnitude range (45sec exposure time) |
|---|---|---|---|
| J | 13.4 - 18.6 | 14.7 - 19.2 | 16.2 - 19.8 |
| H | 16.2 - 19.8 | * | * |
| Ks | 13.1 - 17.5 | 14.7 - 18.1 | * |
Sensitivity
The values in these tables are based on results from the FLAMINGOS-2 Integration Time Calculator and from the early commissioning runs. They assume 70-percentile (IQ70, ~average) image quality for all categories, photometric conditions (CC50), and an airmass of less than 1.2 for the sensitivites presented here. Water vapor has little impact on the near-IR imaging sensitivity, or on spectroscopic sensitivity in the middles of the J, H, and K windows, but does significantly effect the edges of the JHK windows where absorption by telluric water vapor is strong. The estimates also use the measured telescope, camera, and detector performances. Note that some sky conditions vary outside of those stated above. For example, OH emission, although scaled by airmass, can intrinsically vary by over a factor of two from night to night and over much shorter timescales - which can alter S/N and sensitivity by +/- sqrt2 in the J, H, and K bands. Thus observers should use both the table and the ITC with some caution and conservatism.
Regarding readout noise, note that JHKs imaging used CDS readout.
| FLAMINGOS-2 IMAGING SENSITIVITY (S/N=5 IN 1 HOUR, N.I. OVERHEADS) | |||||||||||||||||||||||
| Filter | Center wavelength (µm) | (mag) | Individual Exposure Time (sec) | ||||||||||||||||||||
| Y | 1.02 | 22.2 (in J) | 300 | ||||||||||||||||||||
| J | 1.25 | 23.5 | 36 | ||||||||||||||||||||
| H | 1.65 | 22.7 | 15 | ||||||||||||||||||||
| Ks | 2.20 | 22.8 | 9 | ||||||||||||||||||||
- For imaging, the ITC calculates the S/N in an aperture that maximizes S/N, given the predicted image quality for the observing conditions and wavelength requested. The sensitivity values in the table below use this optimum ITC aperture. For accurate photometry much larger apertures usually must be used, and sensitivities are reduced, typically by a factor of 2 or more.
- Approximate total throughput values in the imaging table are as measured for the entire system, including the telescope, instrument, and detector.
| FLAMINGOS-2 SPECTROSCOPIC SENSITIVITY FOR POINT SOURCES (S/N=5 IN 1 HOUR, N.I. OVERHEADS) | ||||||||||||||||||||||
| Grism | Filter | slit width (arcsec) | (mag) | |||||||||||||||||||
| JH (1200) | JH | 0.36 | 20.5 (J) | |||||||||||||||||||
| HK (1200) | HK | 0.36 | 20.5 (Ks) | |||||||||||||||||||
| R3000 | J | 0.36 | 20.3 | |||||||||||||||||||
| H | 0.36 | 20.2 | ||||||||||||||||||||
| Ks | 0.36 | 19.8 | ||||||||||||||||||||
- Estimated sensitivities are eyeball averages over the specified wavelength intervals. Within each IR band (and indeed within each of these narrow intervals) the sensitivity is a very strong and rapid function of wavelength. The ITC should be used to estimate the signal-to-noise ratio at the precise wavelengths of interest and/or over the entire band of interest.
- The sensitivity per resolution element (which is 2 or more pixels depending on the grism and slit width) is better than the sensitivities in this table by the square root of the number of pixels per resolution element.
- For point sources, the calculation assumes nodding along the slit and an optimized length along the slit (which gives the highest S/N in the extracted spectrum.
- Sensitivities for slitless spectroscopy will be much (typically 10 times or more) worse than the values given in the table.
Photometric Zero points
The zero points for the photometric MKO system were obtained using 88 independent data points from standard stars observations made during the three commissioning runs of May through July 2013.
Y = 25.12 - 0.01*k + 0.50*(Y-J) ± 0.03
J = 25.21 - 0.02*k + 0.87*(J-H) ± 0.05
H = 25.42 - 0.01*k + 0.73*(J-H) ± 0.05
Ks= 24.64 - 0.05*k - 0.27*(H-Ks) ± 0.06
(where k is the extinction coefficient.)
Guiding Options
Two guiding options are available, the F2 On-Instrument Wavefront Sensor (OIWFS) and the telescope's Peripheral Wavefront Sensors (PWFSs). In a nutshell, the PWFS covers a larger range and has a higher probability of finding a suitably bright guide star. However, it also causes severe vignetting of the field, which can impact imaging observations. The OIWFS has a smaller patrol field, but offers minimal vignetting. The OIWFS has experienced several mechanical faults in the past and may be unavailable.
Check with the primary contact scientist of your program about what is the best guiding option for your scientific needs. More details about the guiders are provided below about the F2 OIWFS, and the PWFS2 for non-siderial targets.
F2 OIWFS
The F2 On-Instrument Wavefront Sensor (OIWFS) consists of a 2x2 lenslet array on a moveable arm that patrols an area in front of the mask plane. Signals from the OIWFS are fed to the secondary for fast tip-tilt guiding and to the primary for astigmatism correction. The OIWFS is close to optimally commissioned, but does not yet deliver uniform image quality across the full field of view.
August 1, 2019: The OIWFS is available.
- Limiting magnitude and availability of guide stars: Guide stars for the OIWFS need to be fainter than V=9.5mag. Detailed limiting magnitude measurements for the OIWFS under different conditions are still pending. But the overall performance is expected to be similar to the OIWFS in GMOS-S.
- For the purpose of planning observations for the current semester we suggest more conservative limits than for GMOS-S. Therefore, it is required that guide stars be brighter than V=14.5 mag for guiding on dark sky (BG=50% or BG=20%) in seeing conditions of IQ=70% or IQ=20%. For guiding in moon light under the same seeing conditions (BG=Any), guide stars need to be brighter than V=14.0 mag. For programs that can executed in poorer seeing conditions, guide stars that are 1-2 magnitudes brighter are needed. Users are encouraged to select guide stars as bright as possible.
- Patrol field: The patrol area has the shape delimited with a dashed red line on the schematic diagram below. The patrol area is effectively doubled since the field can be rotated 180 degrees. The red shaded are shows also the vignetting caused by the OIWFS probe arm. The green dasehd line indicates the effective are available for choosing a guide star, after considering the planned offsets in the sequence.
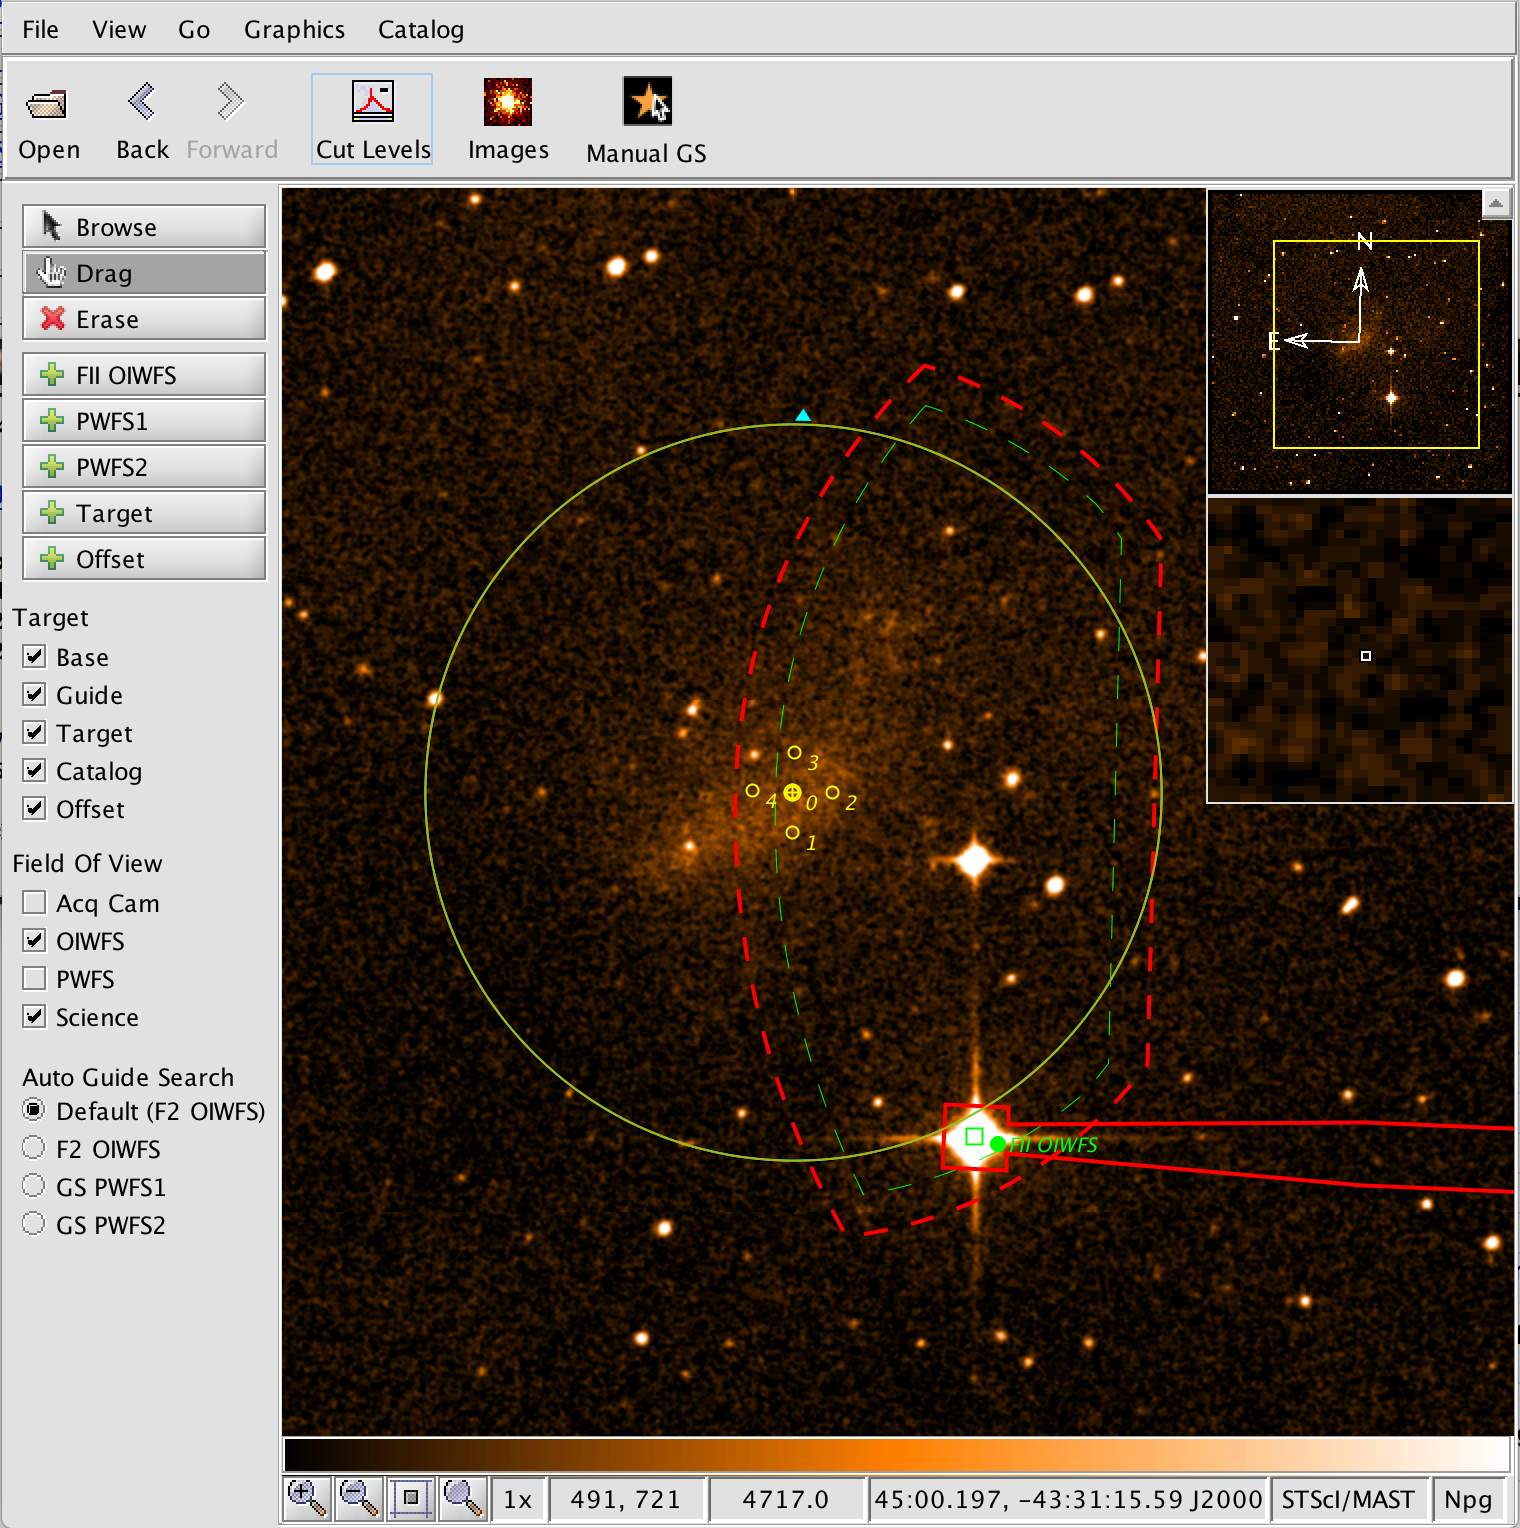
Schematic diagram of the patrol area of the OIWFS (red) relative to the F2 FOV.
| OIWFS detector parameters | |
| Array | EEV CCD-39 |
| Pixel format | 80x80 |
| Pixel size | 24 micron pixels |
| Spectral Response | 0.65 at 450nm, 0.85 at 700nm, 0.42 at 900nm |
| Readout time | 4.71ms for full frame |
| Readnoise | 2.9e-/pix |
| Total noise (on telescope during observations) | pending |
| Dark current (uncooled) | 30 e-/s/unbinned pixel |
PWFS2 (non-siderial targets)
The PWFS2 is available for observing non-siderial targets or when a suitable OIWFS star is not available. There are a few drawbacks with using the P2WFS instead of the OIWFS which are:
- The probe vignettes the F2 FOV.
- The flexure between the probe arm and the detector has not been quantified.
More information on the P2WFS can be found at Peripheral Wavefront Sensor (PWFS2)