|
Animation of Gemini IFU NGC1068 Data
All of the complexity of NGC 1068 and the power of integral field spectroscopy can be seen in this animation of the emission from the 5007 Angstrom line of ionized oxygen. Each frame shows the intensity of the emission at a given velocity (shown at upper right) as we scan outwards, and therefore through, the central region of this Seyfert galaxy. The redshift of NGC 1068 is1140 km/sec so the velocities that are lower than this represent blueshifted gas that is moving towards us. This movie is color coded to represent light intensities, not blue or red shifts. Blue represents low intensity. Red represents high intensity. At the beginning of the movie, we see the light from the near side of the approaching NE (10-11 O'clock position) bowshock. This appears to move towards the nucleus as the inner part of the bowshock is moving less rapidly near the center. Then, as we pass through the disk, a hint of rotation from SW to NE can be seen, and then redshifted light appears in the NE where clumps of gas in the disk are being accelerated downwards by the expanding bowshock from the jet. Finally, light from the gas associated with the receding radio lobe appears SW (4-5 O'clock position) of the nucleus. The emission from the nucleus has a wide range of velocities due to very turbulent motions near the jet and black hole. This video must be credited to "Gemini Observatory: GMOS/IFU Team". |
|||||||||
 Medium-res JPEG (20k) High-res TIFF (10,447k) |
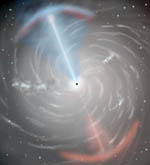
This illustration shows an artist's rendition of the area around the core of NGC 1068 as seen from our point of view on the earth. The large bow-shocks at the end of the jets have been colored red and blue to show where light has been blue shifted (moving toward us), and red shifted (moving away from us).
Artwork by Jon Lomberg, based upon model by Dr. Gerald Cecil, University of North Carolina, Astrophysical Journal, 1 April 2002. Photo credit: "Gemini Observatory". |
||||||||
 Medium-res JPEG (36k) High-res TIFF (11,225k) Medium-res JPEG w/o text (22k) High-res TIFF w/o text (1,304k) |
This illustration shows an artist's rendition of the central region around NGC 1068 as seen from the edge of the disk that surrounds the core's black hole. The red and blue shifted radiation formed by the interaction between the disk and the bowshock at the end of the jets can be seen above and below the disk. Blue shifted light is moving toward us and red shifted light is receding.
Artwork by Jon Lomberg, based upon model by Dr. Gerald Cecil, University of North Carolina, Astrophysical Journal, 1 April 2002. Photo credit: "Gemini Observatory". |
||||||||
|
|
This wide field image of NGC 1068 shows the actual field of the Gemini IFU as an inset box. The image connected to the box is from the actual IFU image set and has extremely high resolution of approximately 0.4 arcseconds.
Photo credit: "Gemini Observatory: GMOS/IFU Team" |
||||||||
|
|
This illustration shows a simplified Integral Field Unit's (IFU) operation based upon a 3X3 fiber optics array. In the diagram, the light from the image of the galaxy is transported through optical fibers to a spectrograph (indicated by prism). A spectrum is produced by each fiber and captured on a large CCD detector. In reality, Gemini's IFU has as many 1500 individual optical fibers (rather than just the 9 shown in this illustration). This many fibers produce data sets of extremely high resolution and produce a huge amount of data for very efficient observations. Artwork by Jon Lomberg. Photo credit: "Gemini Observatory". |
||||||||
|
Medium-res JPEG (80k) |
This illustration shows a simplification of the basic principle behind Integral Field Spectroscopy. Here, a 3x3 array of spectroscopic data has been represented from a hypothetical galaxy. From the spectra, individual velocities can be determined to study such things the rotation of the galaxy. In the bottom grid, regions moving toward us are shown in blue/foreground and regions moving away are shown in red/background. The Gemini Integral Field Unit on GMOS has as many as 1500 fibers rather than the 9 points shown here for simplicity. Artwork by Jon Lomberg. Photo credit: "Gemini Observatory". |
||||||||